



User guide
How to build a survey and read its results, one task at a time.
Contents · 13 sections
Get started
New here? Start with one of these.
How a survey runs
Goals and metrics
What you want to learn and how you’ll judge the results
Virtual customers
How many virtual customers take part, and who they are
Screens and tasks
The screens, actions and task to compare
Interview setup
Confirm the briefing, write the questions, then start
Run the survey
Progress and answers as they arrive
Report
Results, analysis and suggested fixes
Build a survey
Create a survey
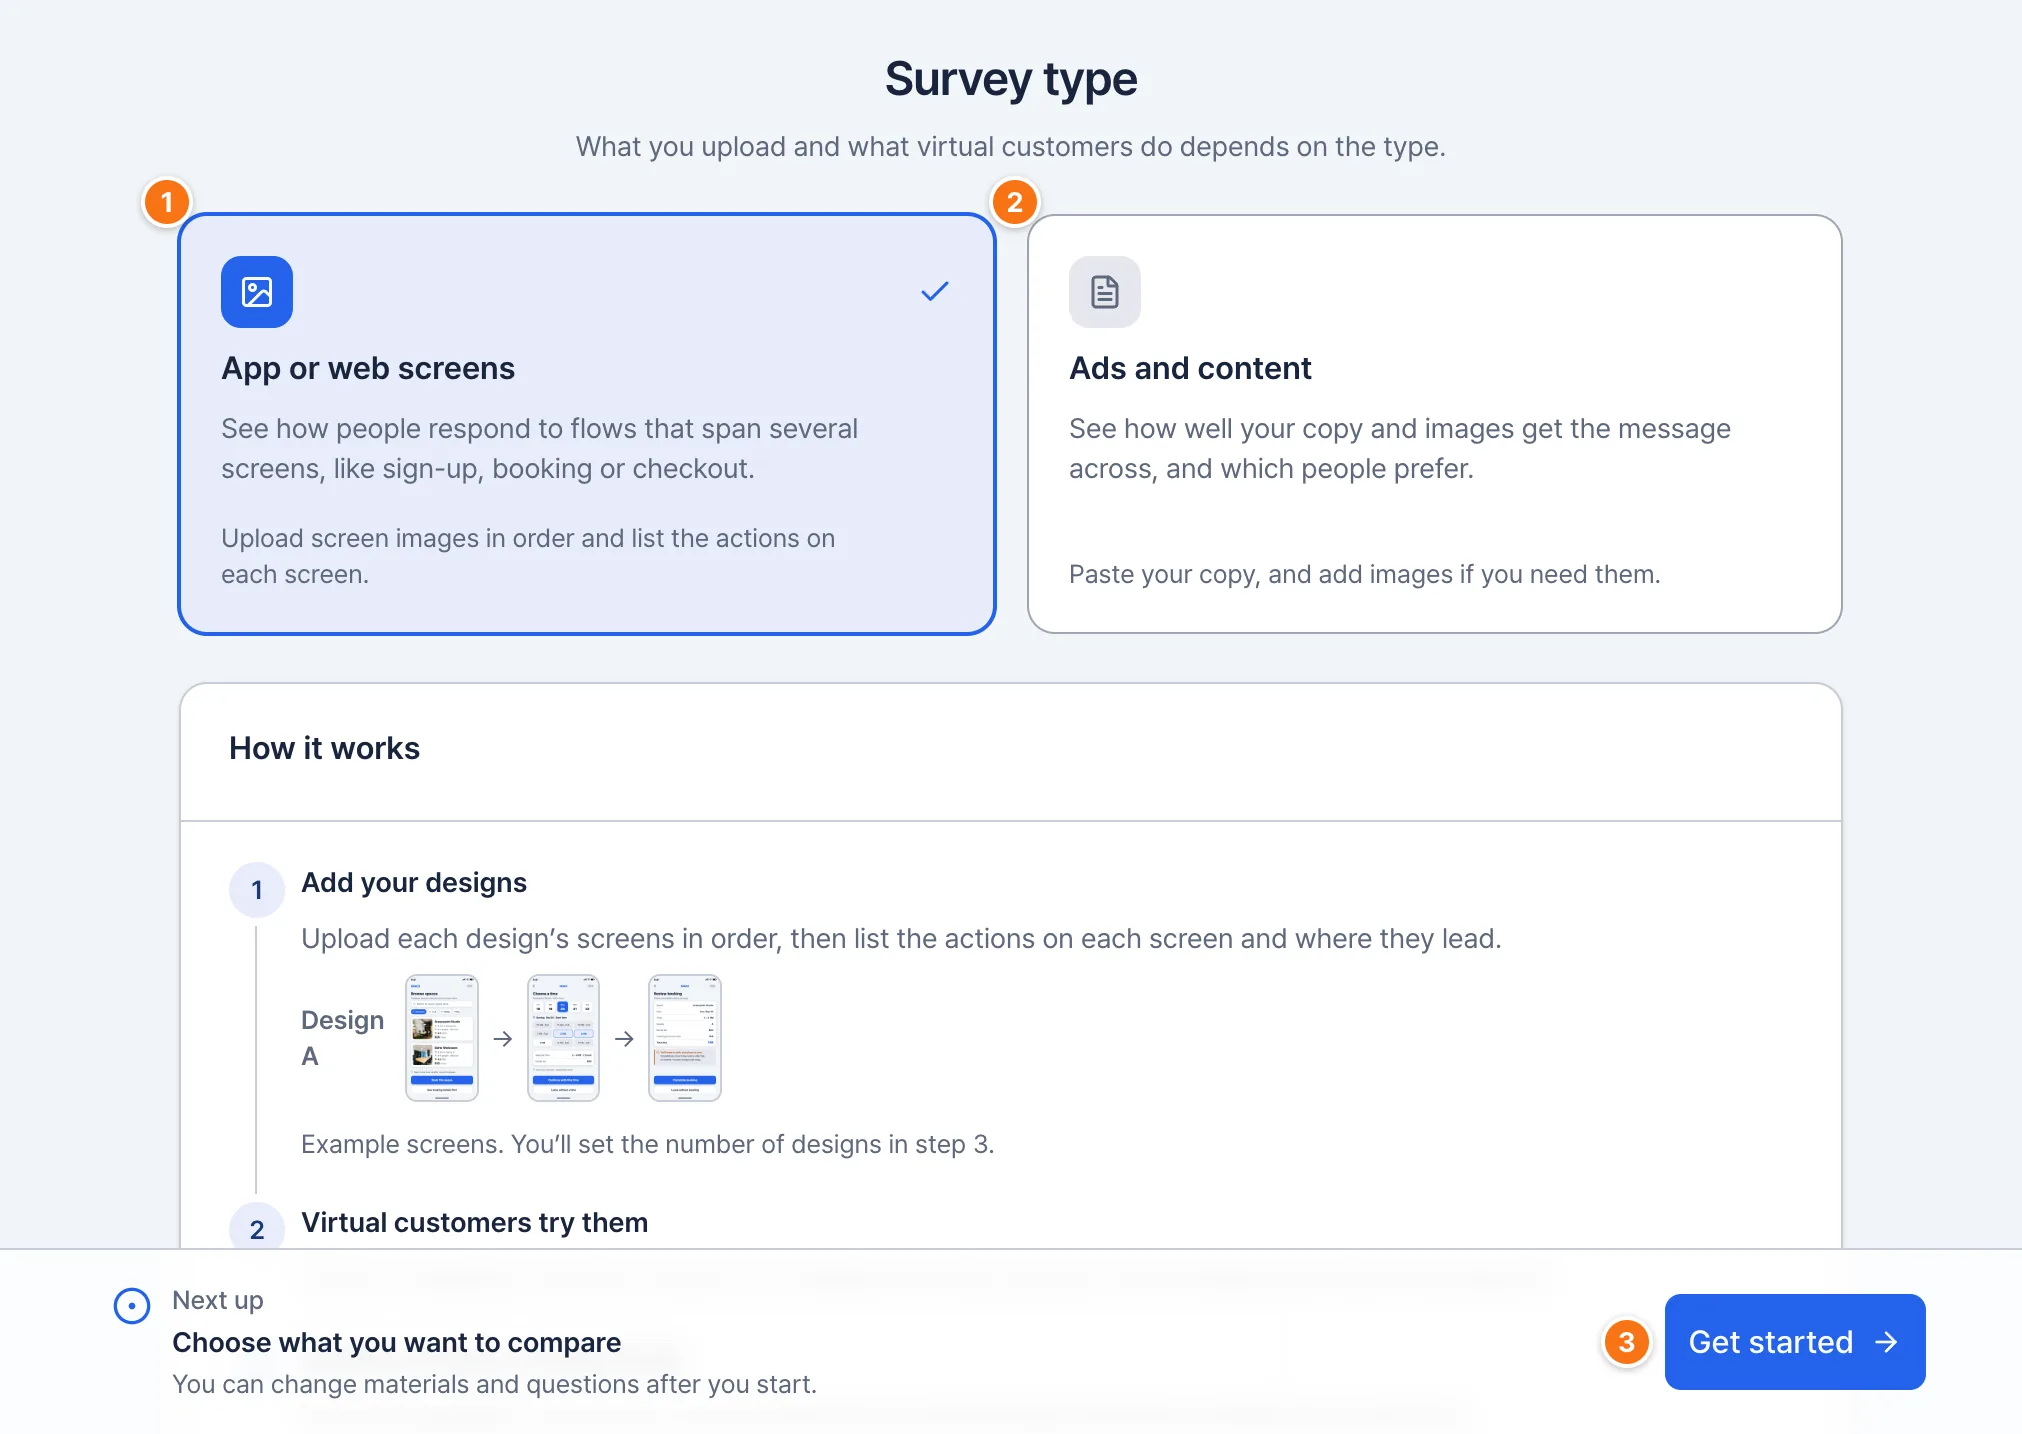
Select ‘New survey’ in My surveys or the top bar. A new survey is created and you choose its type.
How to use
App or web screens
For flows that span several screens, like sign-up, booking or checkout.
Ads and content
For comparing ad copy and images.
Get started
Takes you to step 1, Goals and metrics, with the type you chose.
Checkpoints
- What you add in step 3 depends on the type: screen images for app or web screens, copy and images for ads and content.
- An ‘Untitled survey’ appears under Drafts in the left menu. Once you describe what you want to learn in step 1, that sentence becomes its name.
Build a survey
Set goals and metrics
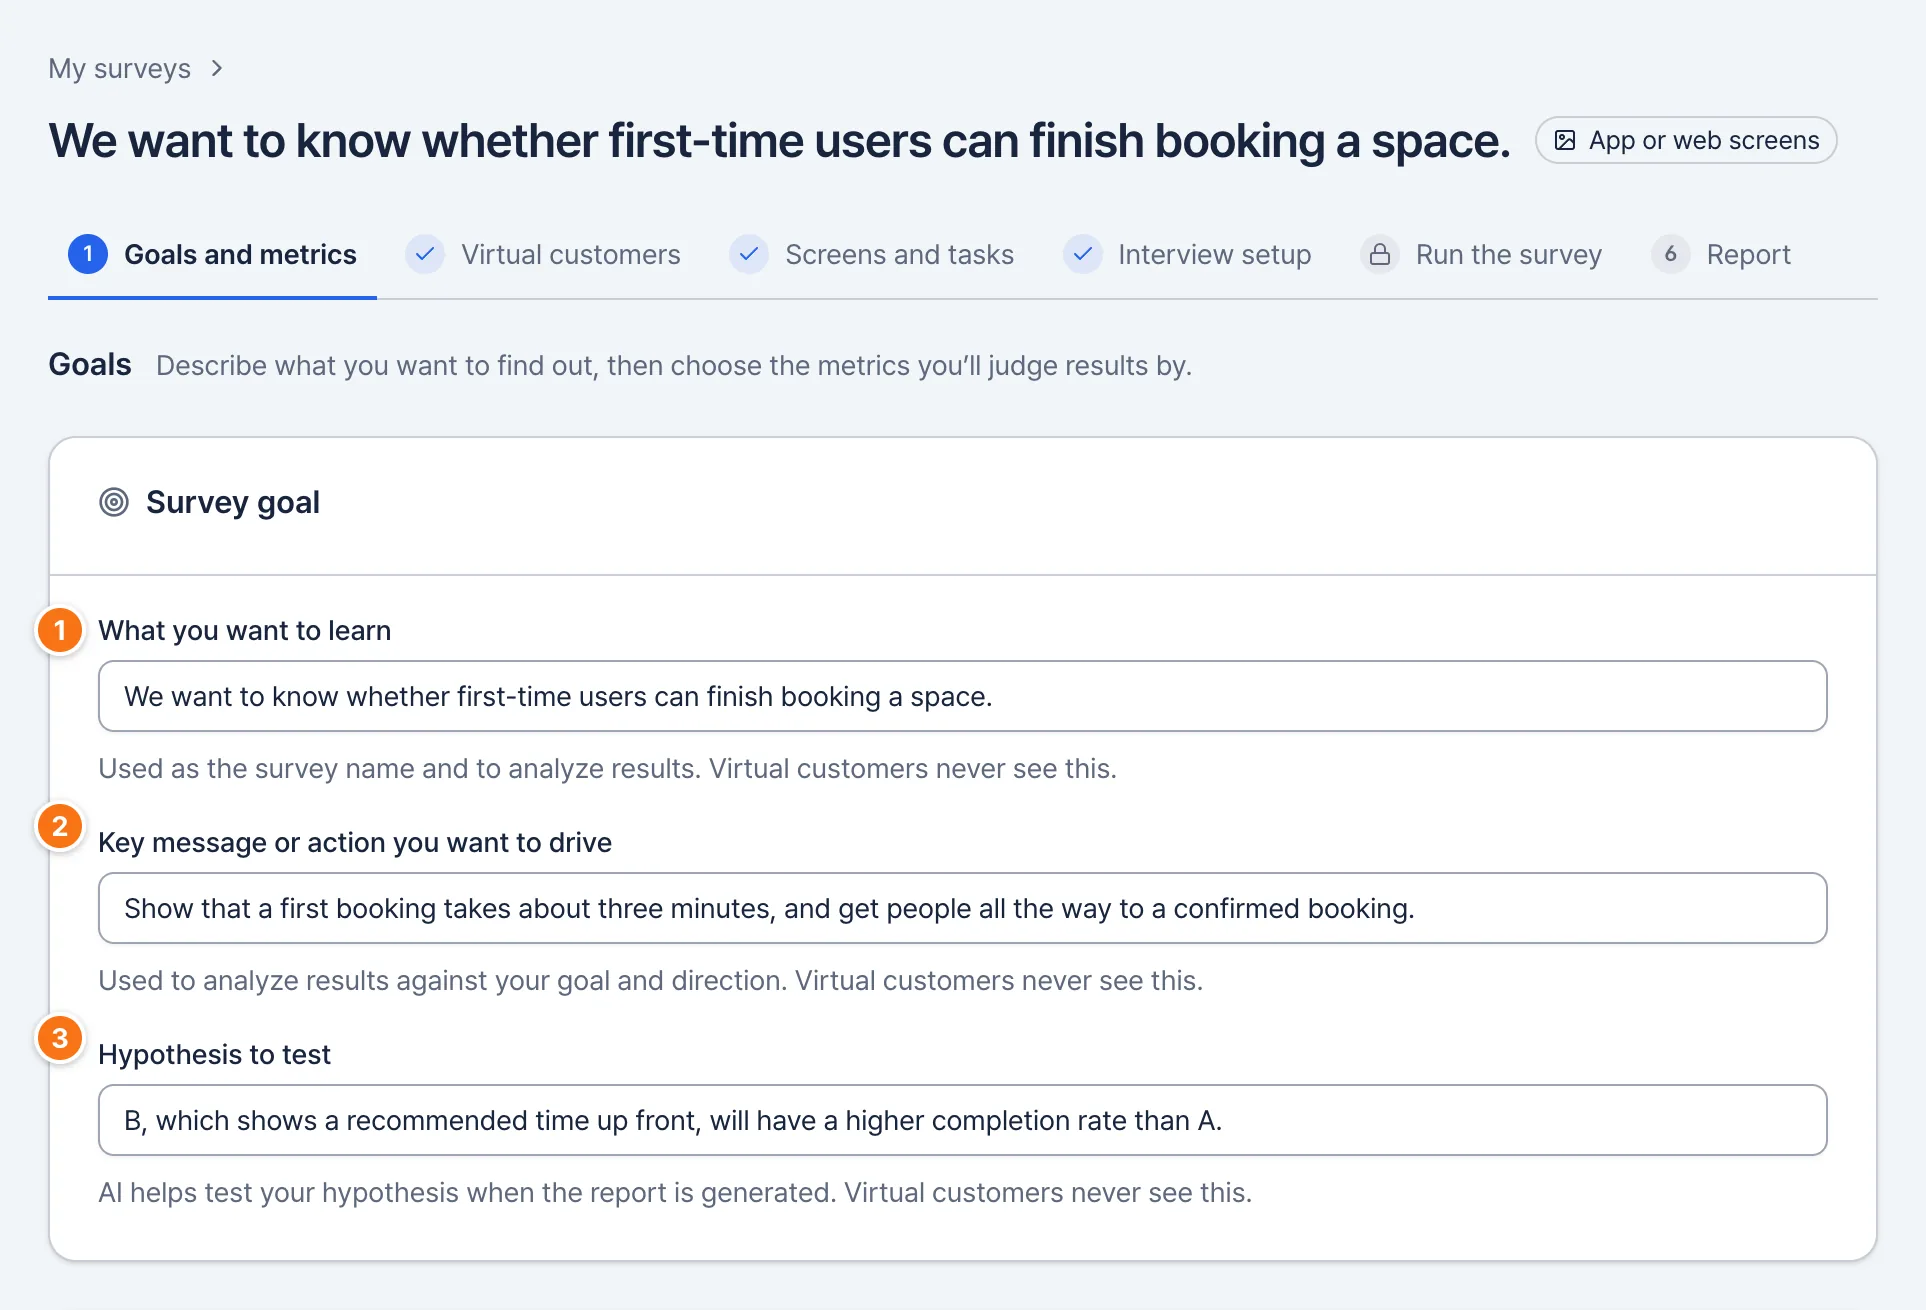
In step 1, Goals and metrics, set what you want to learn and how you’ll judge the results.
Survey goal
How to use
What you want to learn
One sentence on what this survey should find out. For example: “We want to know whether first-time users can finish booking a space.”
Key message or action you want to drive
What your screens or ad are meant to get across. Optional.
Hypothesis to test
What you expect the results to show. Optional.
Checkpoints
- Fill in what you want to learn and the message field and Goal metrics card appear. Fill in the message and the hypothesis field appears.
- What you want to learn is the survey’s name. It updates the page title and the left menu as you type.
- With a hypothesis, the report’s overall take says whether the results support it, contradict it, or can’t tell.
These fields are used to analyze results. Virtual customers never see them.
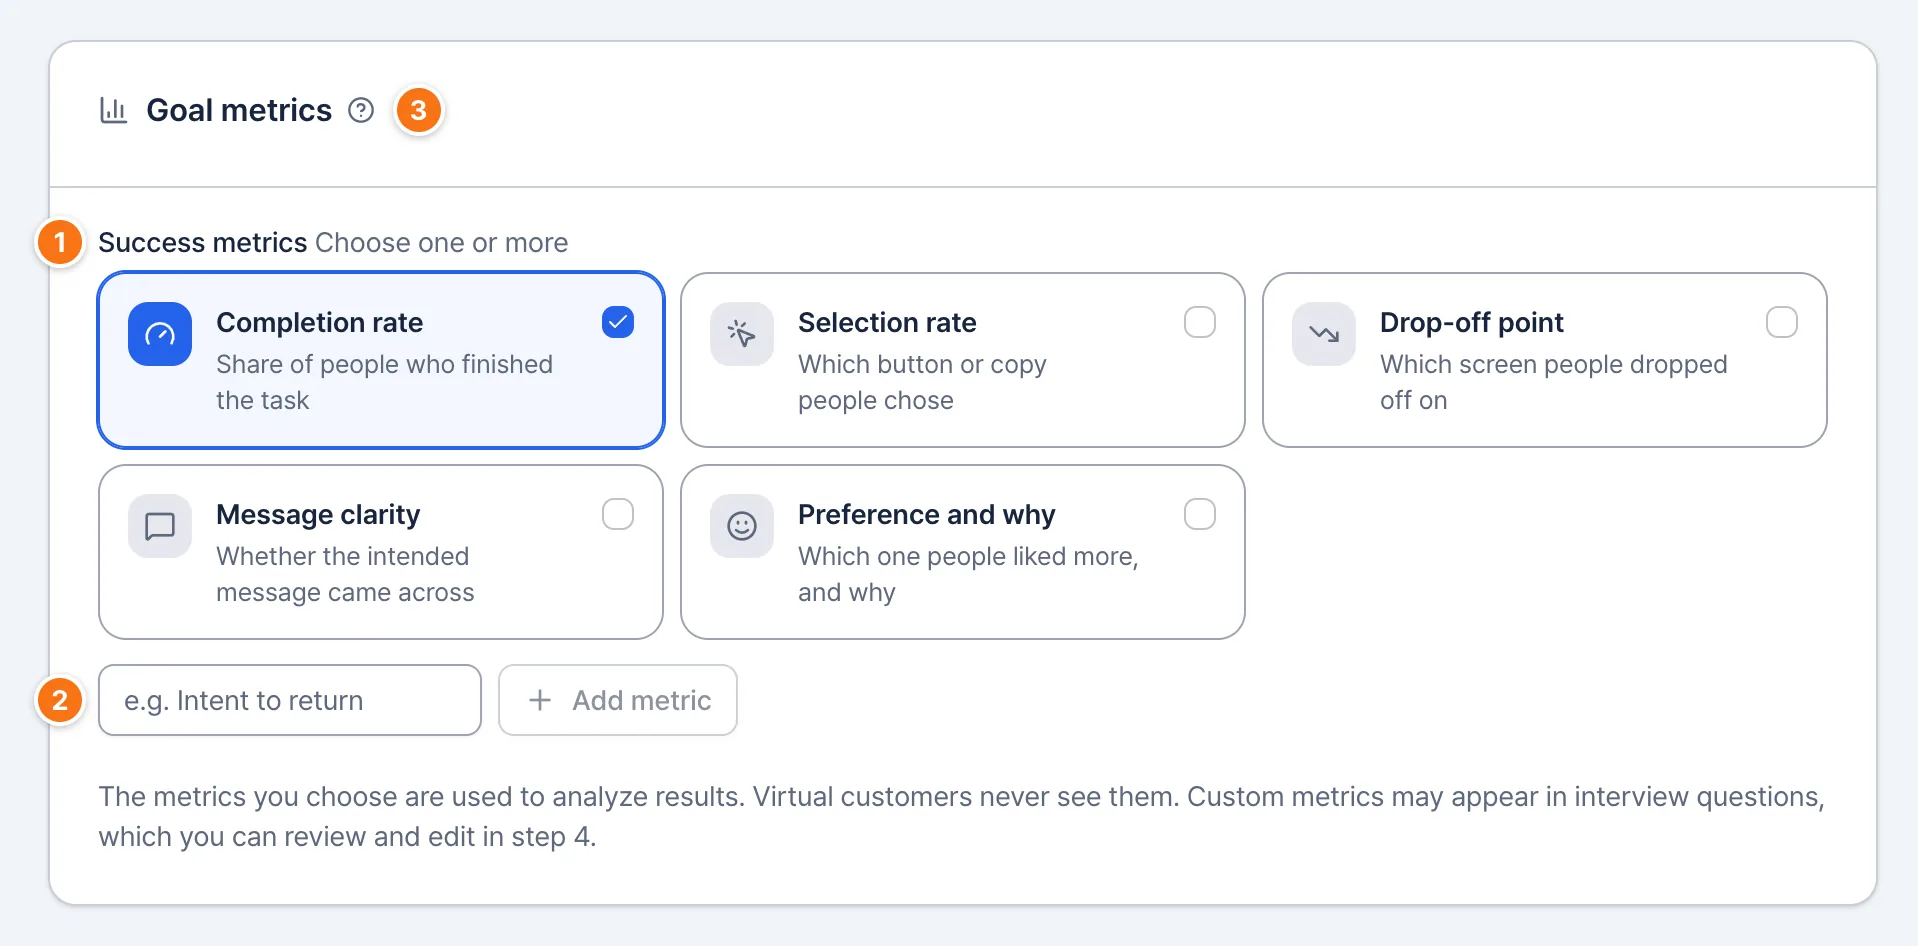
Goal metrics
How to use
Success metrics
Choose at least one: completion rate, selection rate, drop-off point, message clarity, or preference and why.
Custom metric
For a metric that isn’t listed, type it in and select ‘Add metric’.
About goal metrics
Select ? to see what each metric measures.
Checkpoints
- You can select ‘Next’ and move on to step 2, Virtual customers, once at least one metric is chosen.
- Each metric’s result by design appears in the report’s summary and under ‘Metric impact’.
- Custom metrics aren’t calculated. AI uses them when it writes interview questions in step 4.
Build a survey
Choose virtual customers
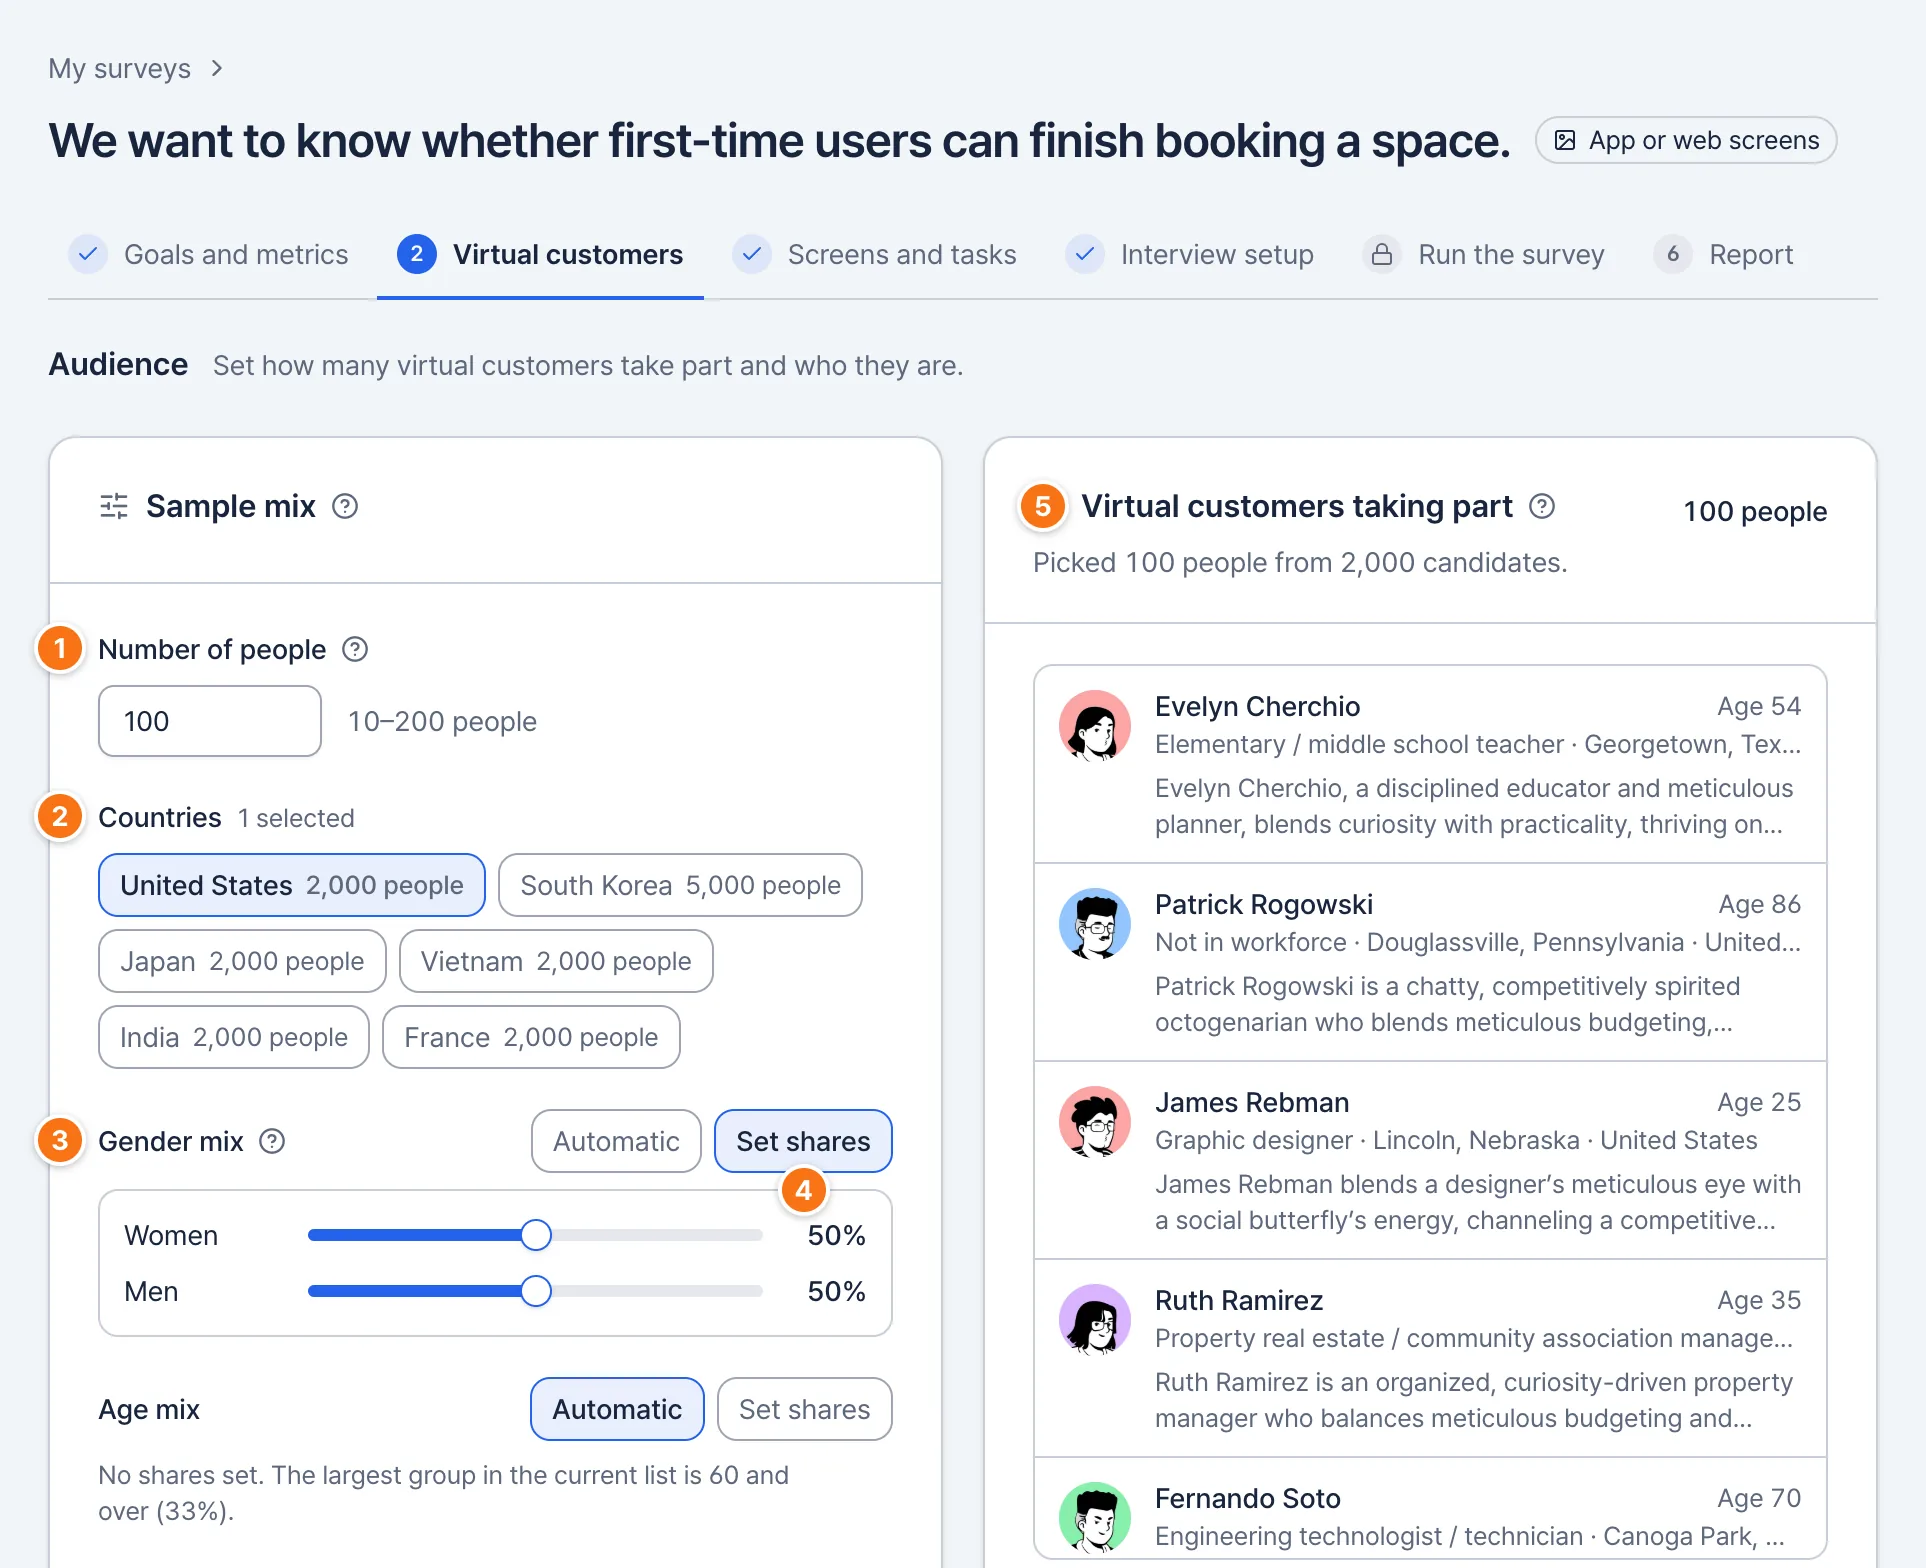
In step 2, Virtual customers, set how many virtual customers take part and who they are.
Size and mix
How to use
Number of people
Anywhere from 10 to 200. The default is 100, and the Free plan allows up to 100.
Countries
Where virtual customers come from. The number next to each country is how many candidates it has.
Gender mix
Drag the slider to set the share of women and men.
Automatic · Set shares
Set shares shows the sliders. Automatic follows each country’s real population. Age mix works the same way.
Virtual customers taking part
The people picked, each with a short profile.
Checkpoints
- Change the size, countries or mix and the list updates right away.
- Raise one slider and the others come down with it, so the total stays at 100%.
- If there aren’t enough candidates, the mix gets as close as it can and the list shows how many were actually picked.
- Each 100 virtual customers use 1 report, so 200 people use 2. Twice as many people takes about twice as long to run.
Areas and screening criteria
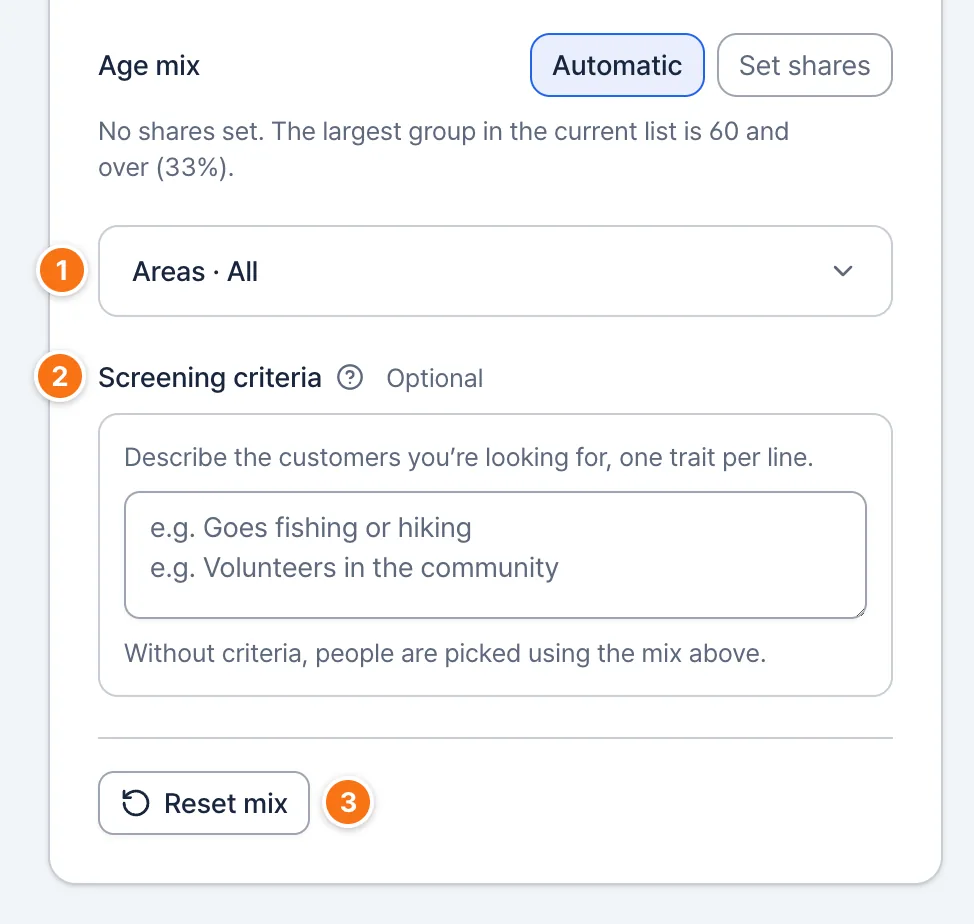
How to use
Areas
Open it to pick people only from certain areas.
Screening criteria
Describe the customers you’re looking for, one trait per line, up to 5 lines. Then select ‘Find matching people’.
Reset mix
Sets countries, shares and areas back to their defaults. Your criteria stay.
Checkpoints
- Select ‘Find matching people’ and AI reads each candidate’s profile, then moves people who match to the top of the list.
- You can keep working on other fields while AI checks. Progress shows under the field.
- When it’s done, people who match are marked ‘Matches criteria’, and a line like “42 of 100 people match” shows the result.
- If too few people match, the remaining places go to other candidates.
- After you edit the criteria, select ‘Find matching people’ again.
Build a survey
Add screens and a task
In step 3, Screens and tasks, write the task virtual customers will do and add the screens you want to compare.
Situation, task and number of designs
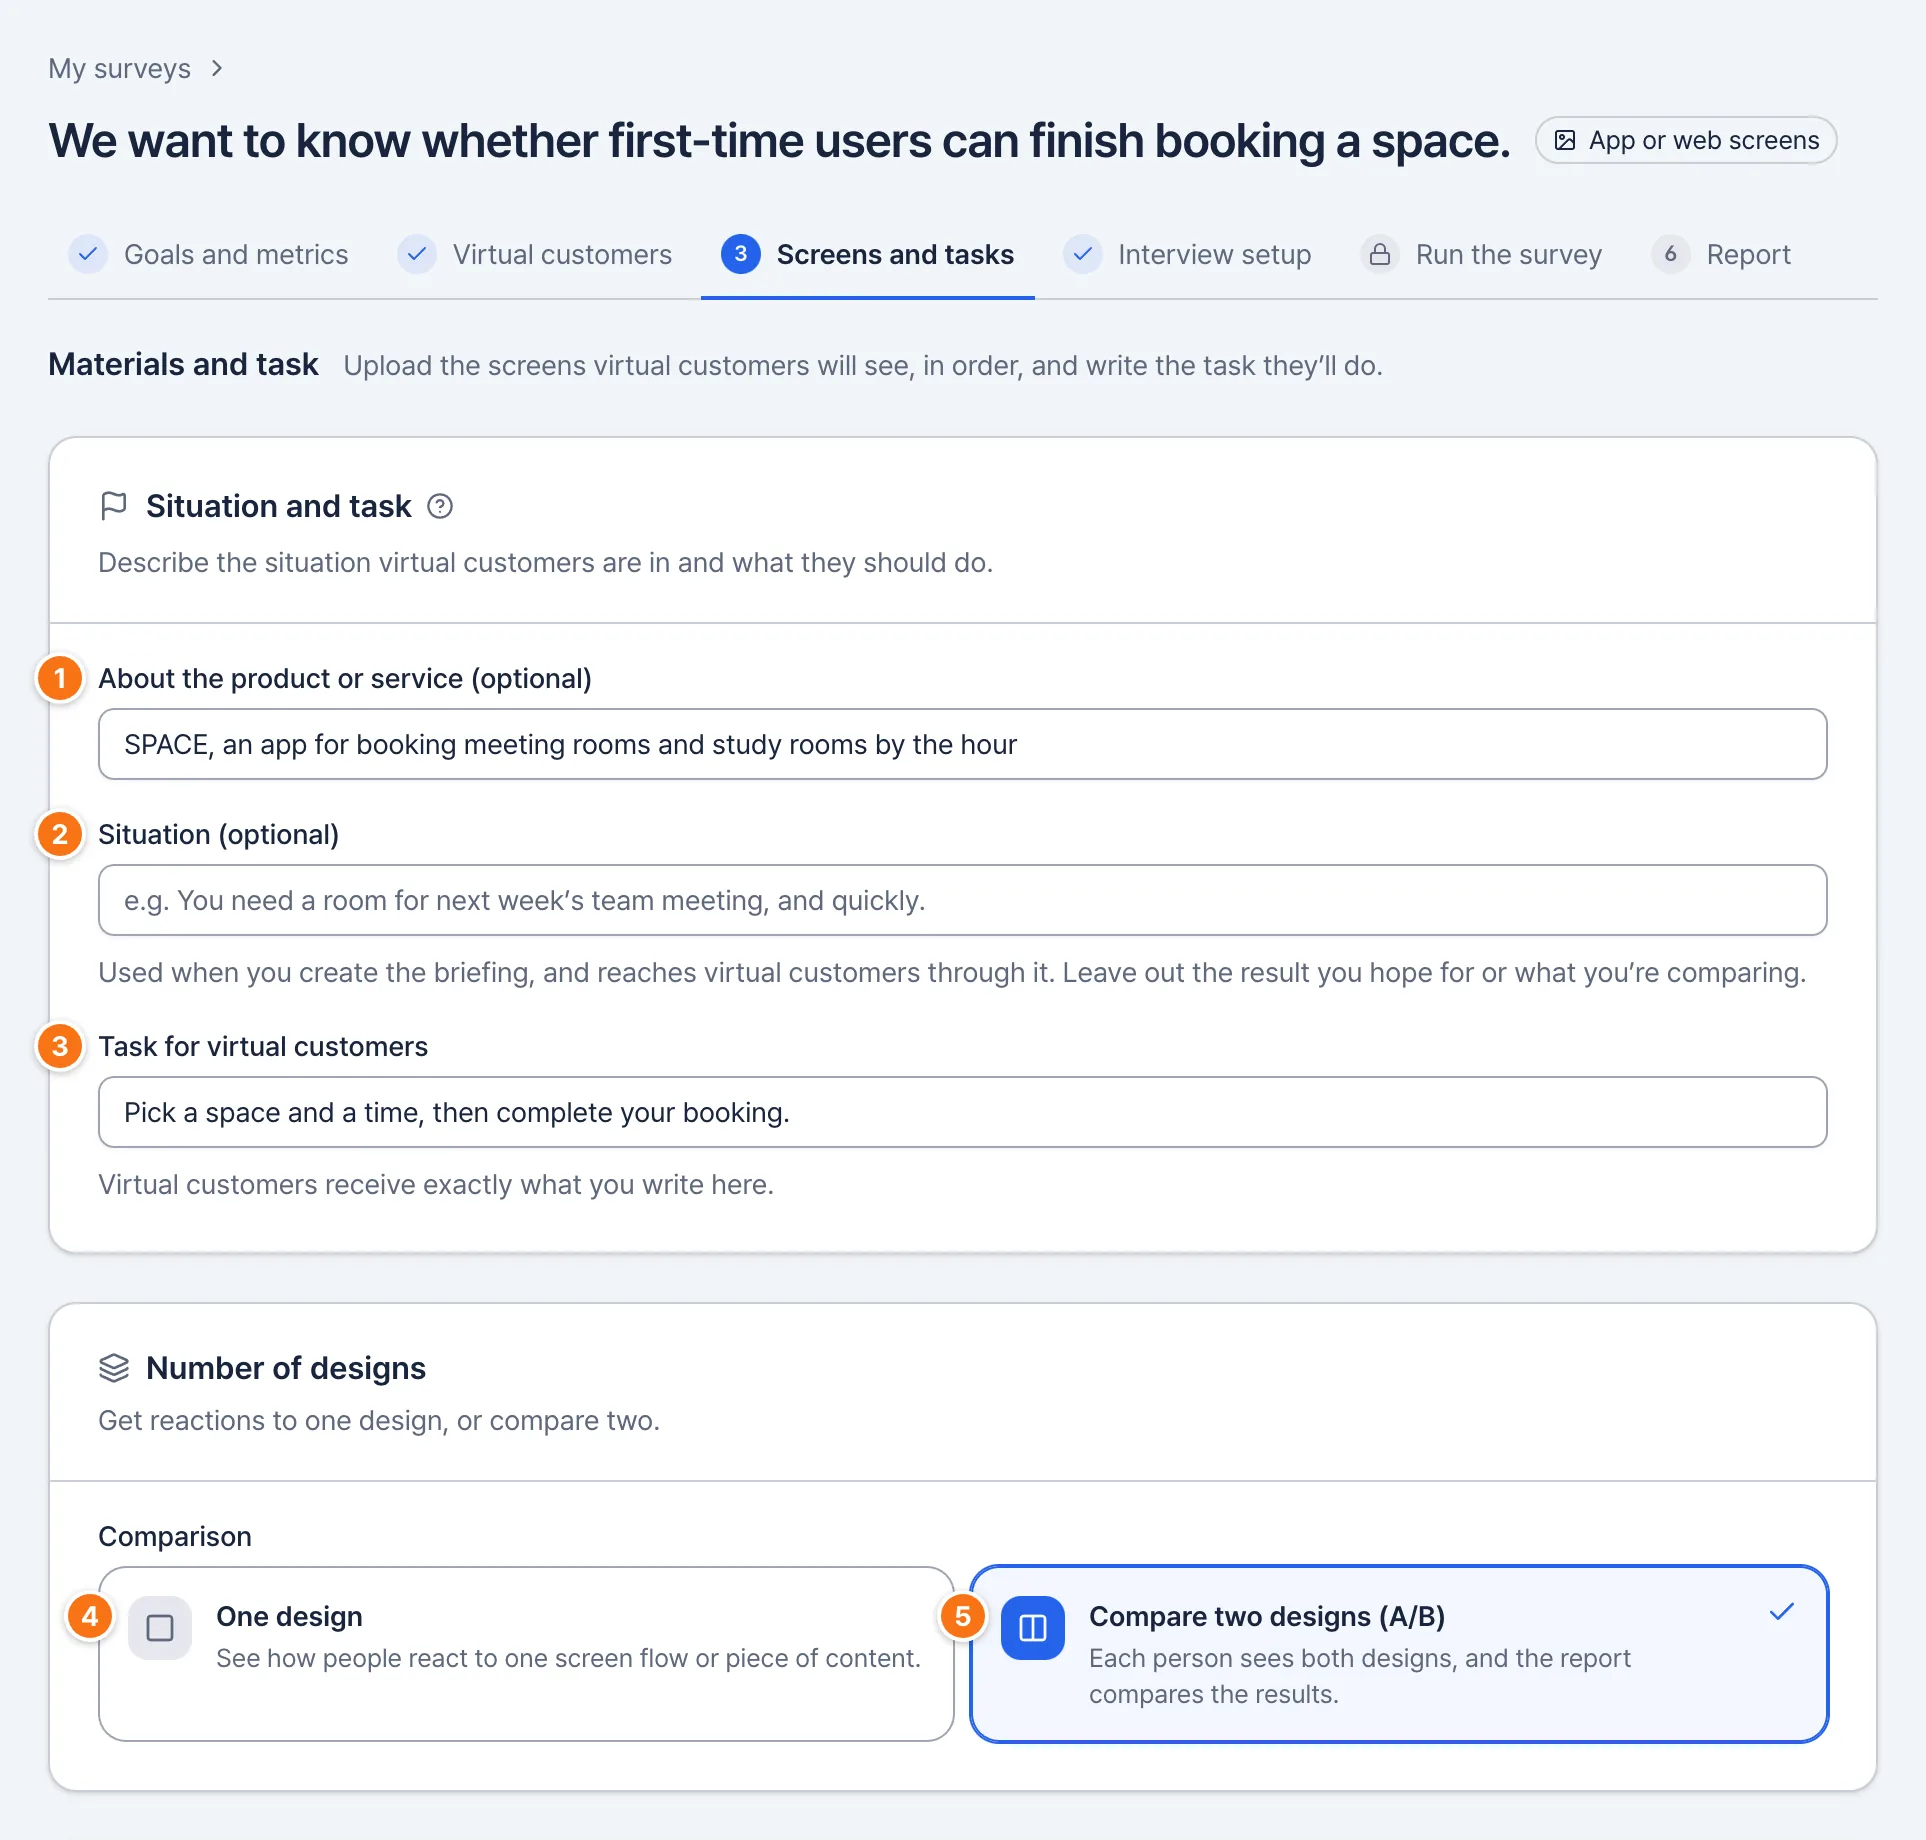
How to use
About the product or service
One line on what the screens are for. Optional. For example: “SPACE, an app for booking meeting rooms and study rooms by the hour”.
Situation
The situation virtual customers are in. Optional. For example: “You need a room for next week’s team meeting, and quickly.”
Task for virtual customers
What virtual customers should try to do on your screens. For example: “Choose a space and a time, and finish booking.”
One design
To see how people react to a single flow.
Compare two designs (A/B)
To compare two designs. Each virtual customer tries both.
Checkpoints
- Choose two designs and every step gets a design A and a design B slot side by side.
- If design B has any screens, copy or images, switching back to one design asks whether to delete design B.
The product description and situation are used when you create the briefing; the task reaches virtual customers exactly as written.
Screens
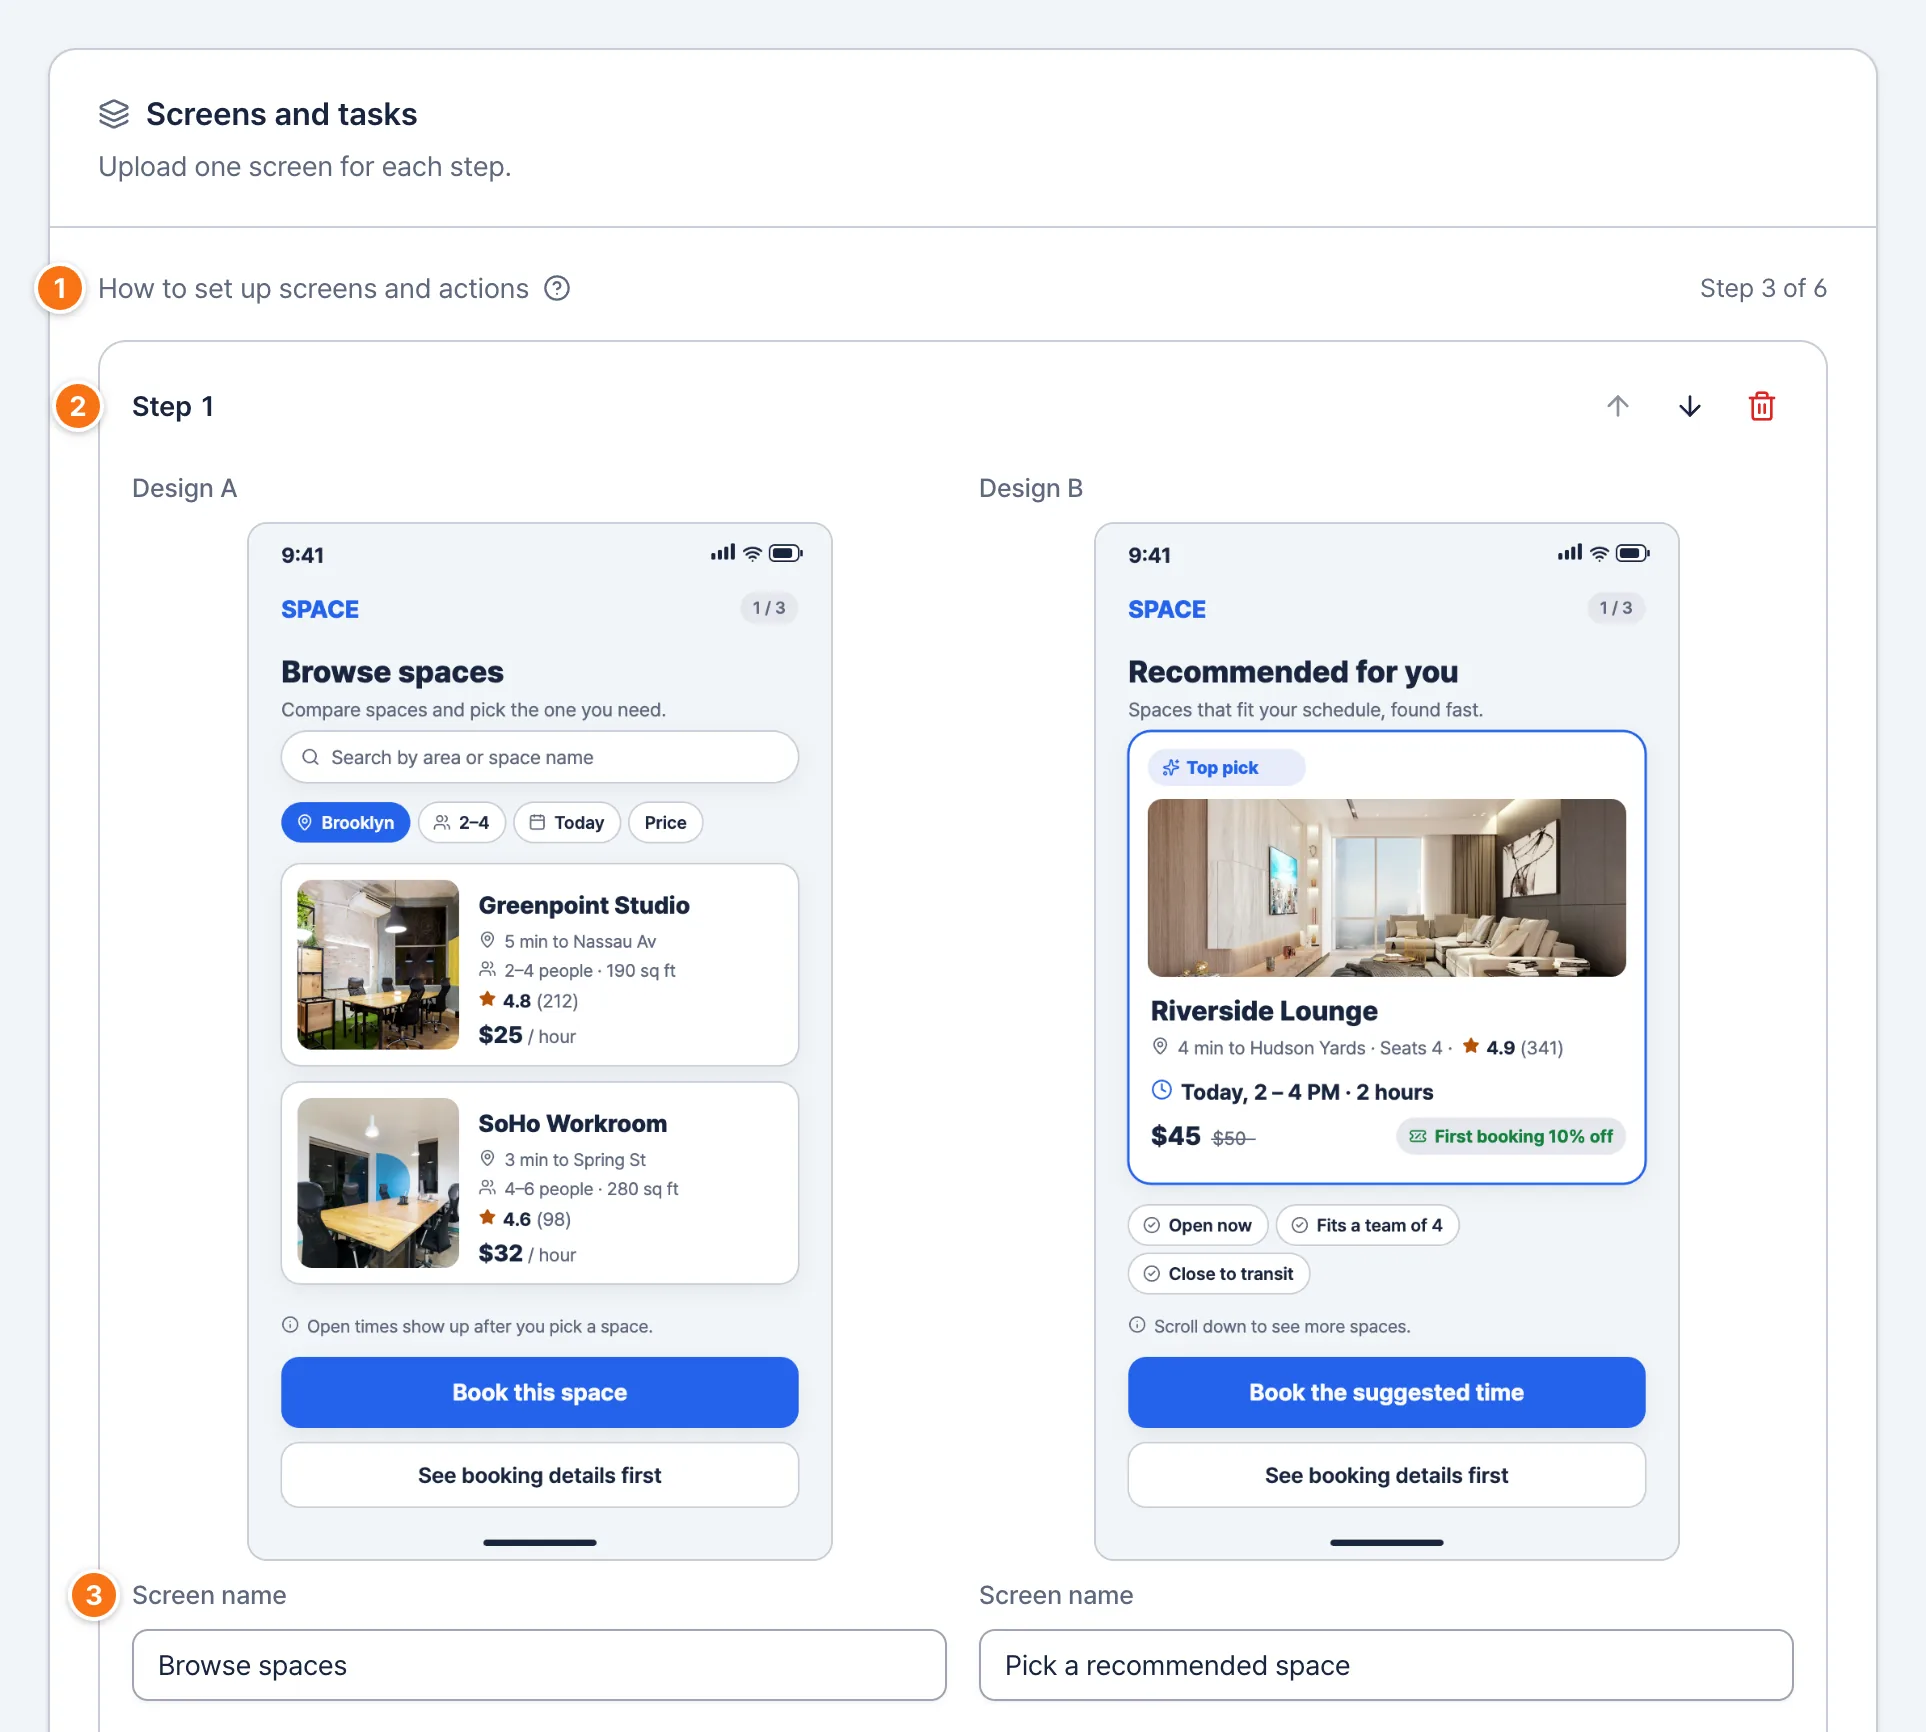
How to use
How to set up screens and actions
Select ? for examples.
Step
Add screen images with ‘Upload next screen image’ below the card. Each image is one step.
Screen name
The name the report uses for this screen.
Checkpoints
- Each image you upload adds a step. Use the arrows at the top right of a step to reorder.
- With two designs, deleting one design’s screen empties only that slot. To delete a whole step, use the trash icon at the top right of the step.
- Replace an image and you’re asked to check that the existing actions still fit. Select ‘Keep as is’ once they do.
- Images must be PNG, JPEG or WebP, up to 5 MB and 4,096 px wide or tall. A survey holds up to 24 files.
Actions and where they lead
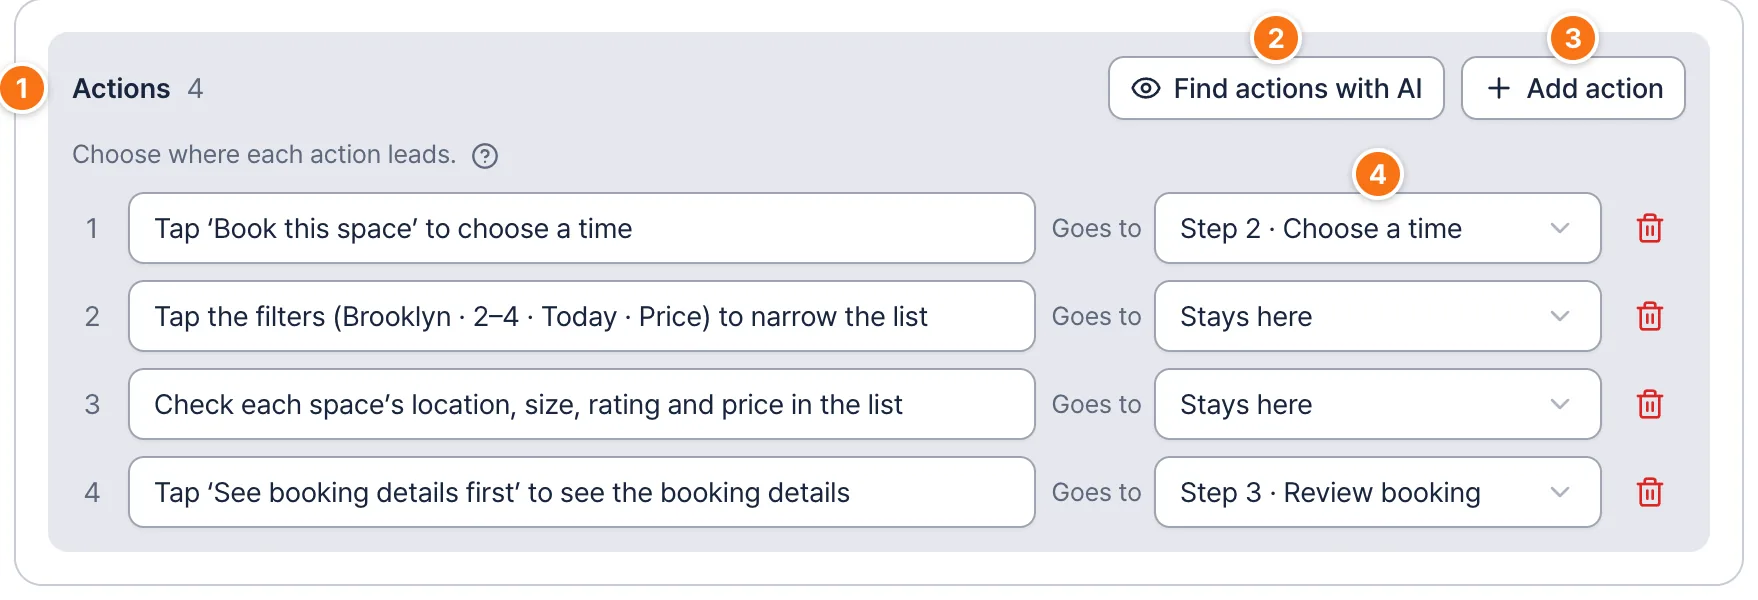
How to use
Actions
What people can do on this screen, in one sentence. For example: “Tap ‘Book this space’ to choose a time”.
Find actions with AI
AI reads the screen and finds what people can tap or check, written as action sentences.
Add action
Adds an action line you fill in yourself.
Goes to
For each action, choose another step, ‘Stays here’, ‘Task completed’ or ‘Didn’t find it’.
Checkpoints
- Finding actions with AI usually takes 10–30 seconds. Each action it finds shows its role, such as ‘To the next screen’, ‘Stays on this screen’ or ‘Finishes the task’. Keep the ones you want checked and select the add button.
- ‘Connect it yourself’ means AI didn’t decide where the action leads. After adding it, choose where it goes. Until you do, ‘Next up’ at the bottom reminds you.
- Designs A and B share one action list. Only the screen images differ.
- Only virtual customers who tap an action leading to ‘Task completed’ count as finishing the task.
Ads and content surveys
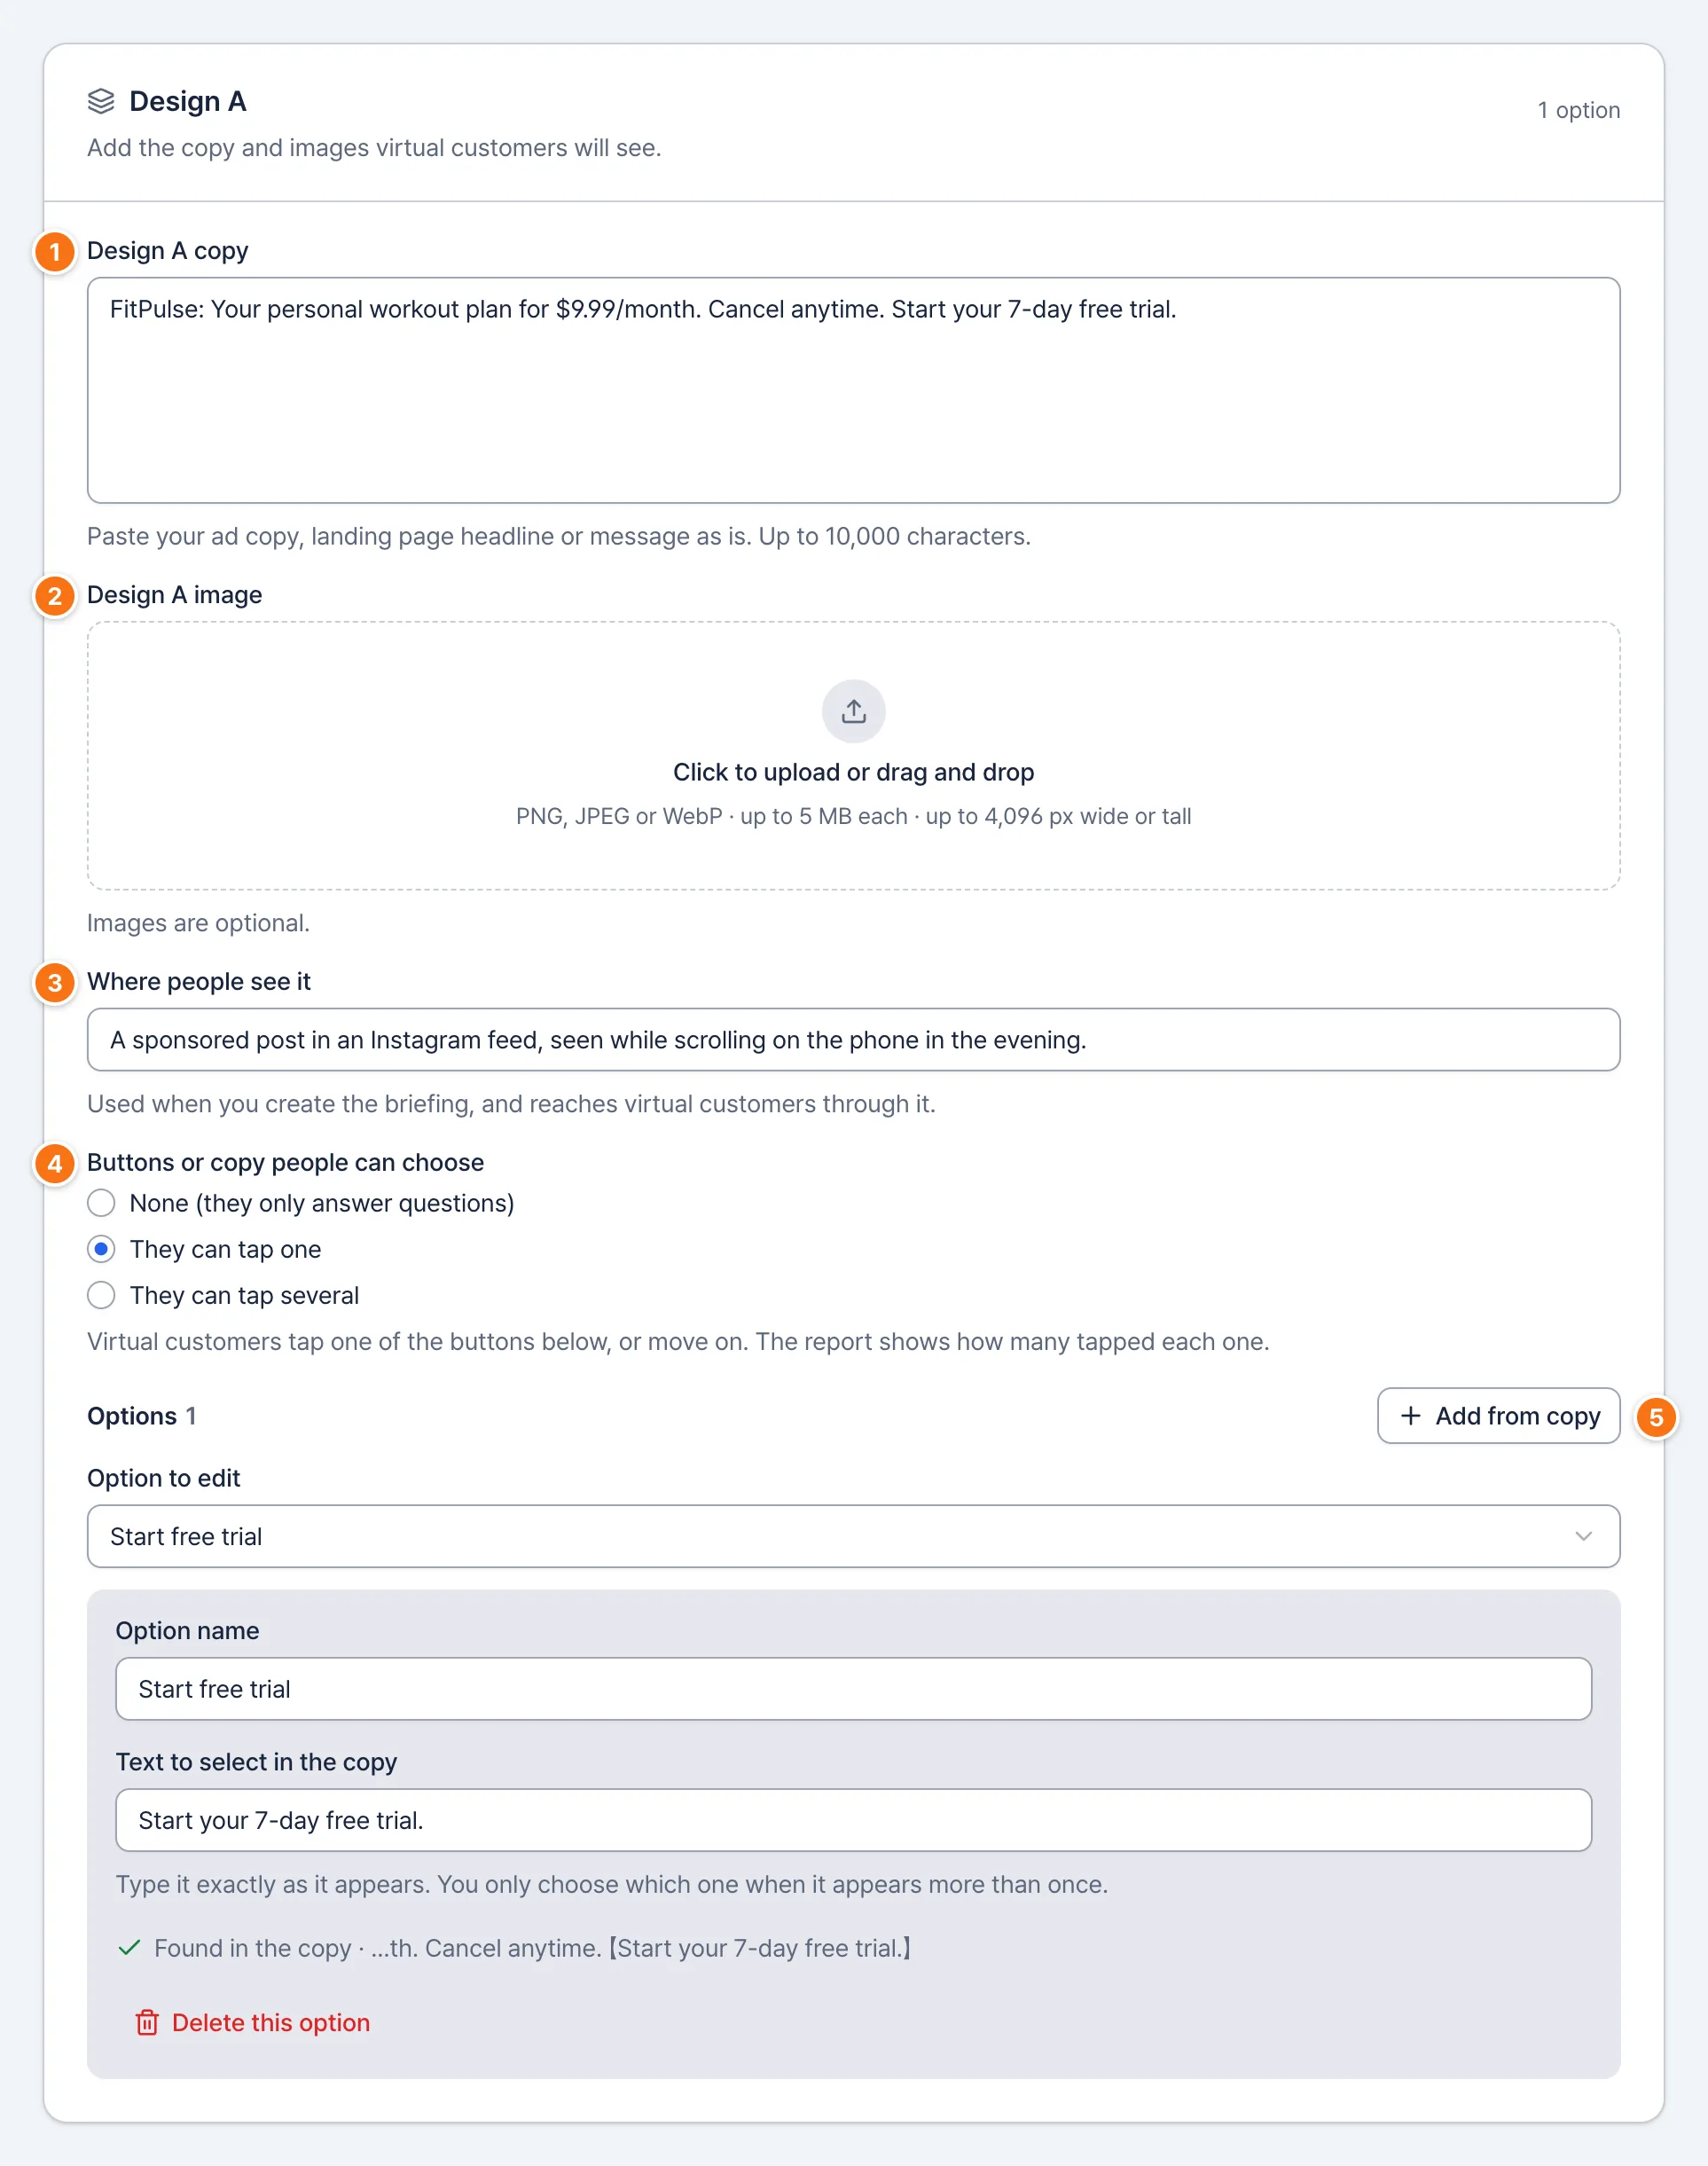
How to use
Design A copy
Paste your ad copy, landing page headline or message as is. Up to 10,000 characters.
Design A image
Add the ad image if there is one. It’s optional.
Where people see it
The situation people see the ad in. For example: “On the subway on the way home from work.”
Buttons or copy people can choose
If the ad has a button, choose ‘They can tap one’ or ‘They can tap several’.
Add from copy
Turns a phrase in your copy into an option people can choose.
Checkpoints
- In an ads and content survey, step 3 is called ‘Content and tasks’.
- With two designs, design B’s card follows below and works the same way.
- Once you set options, the report shows how many people chose each one.
- ‘Where people see it’ is used when you create the briefing, and reaches virtual customers through it.
- An ads and content survey’s task card has no ‘Situation’ field. Enter ‘Where people see it’ for each design instead.
Build a survey
Prepare the briefing and questions
In step 4, Interview setup, confirm the briefing virtual customers read before they start, and write the questions they answer afterward.
Write and confirm the briefing
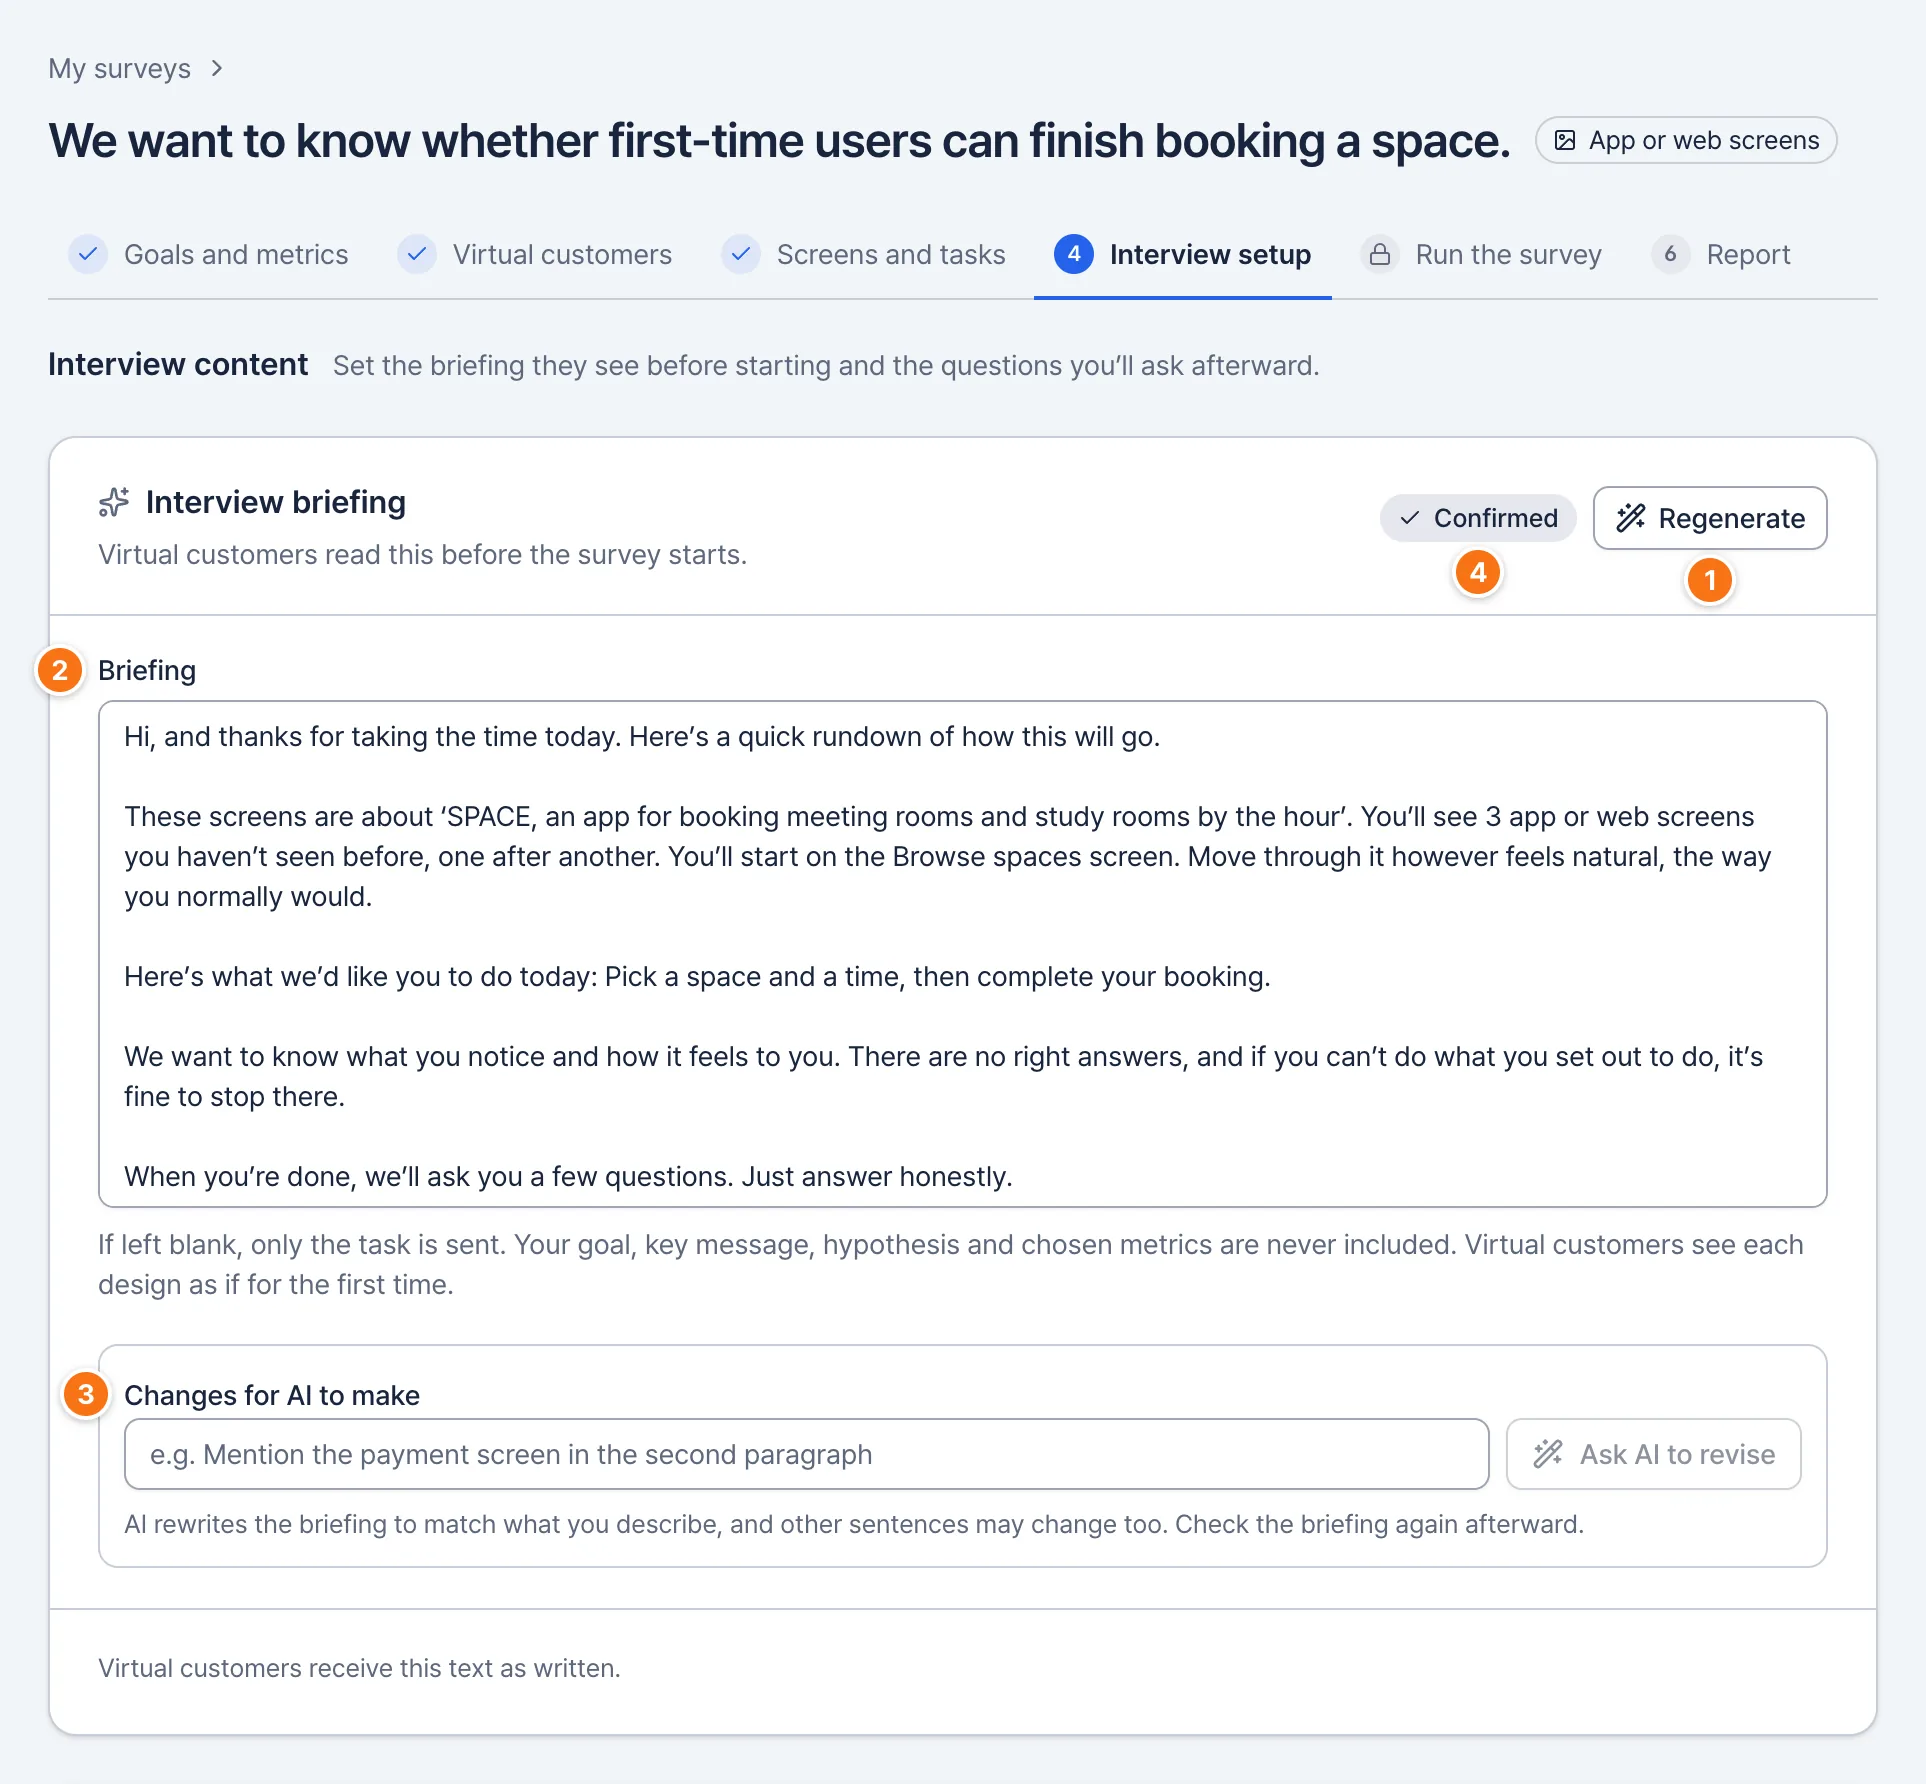
How to use
Write briefing with AI
AI drafts the briefing. Once it has, this button reads ‘Regenerate’.
Briefing
Edit the draft yourself.
Changes for AI to make
Describe the change and select ‘Ask AI to revise’. AI rewrites the briefing, so other sentences may change too.
Confirm
Review it and select ‘Confirm’. It then shows ‘Confirmed’.
Checkpoints
- AI writes the briefing from what you entered in step 3, smoothing the wording. It doesn’t add times, places or circumstances you didn’t write.
- If you change what the briefing is based on after confirming, such as the screens, actions, ‘Where people see it’, task or number of designs, confirm the briefing again. The warning lists what changed.
- If the briefing gives away the survey’s intent, like its goal or hypothesis, you’ll see a warning.
If left blank, only the task is sent. Your goal, key message, hypothesis and metrics are never included in the briefing.
Interview questions
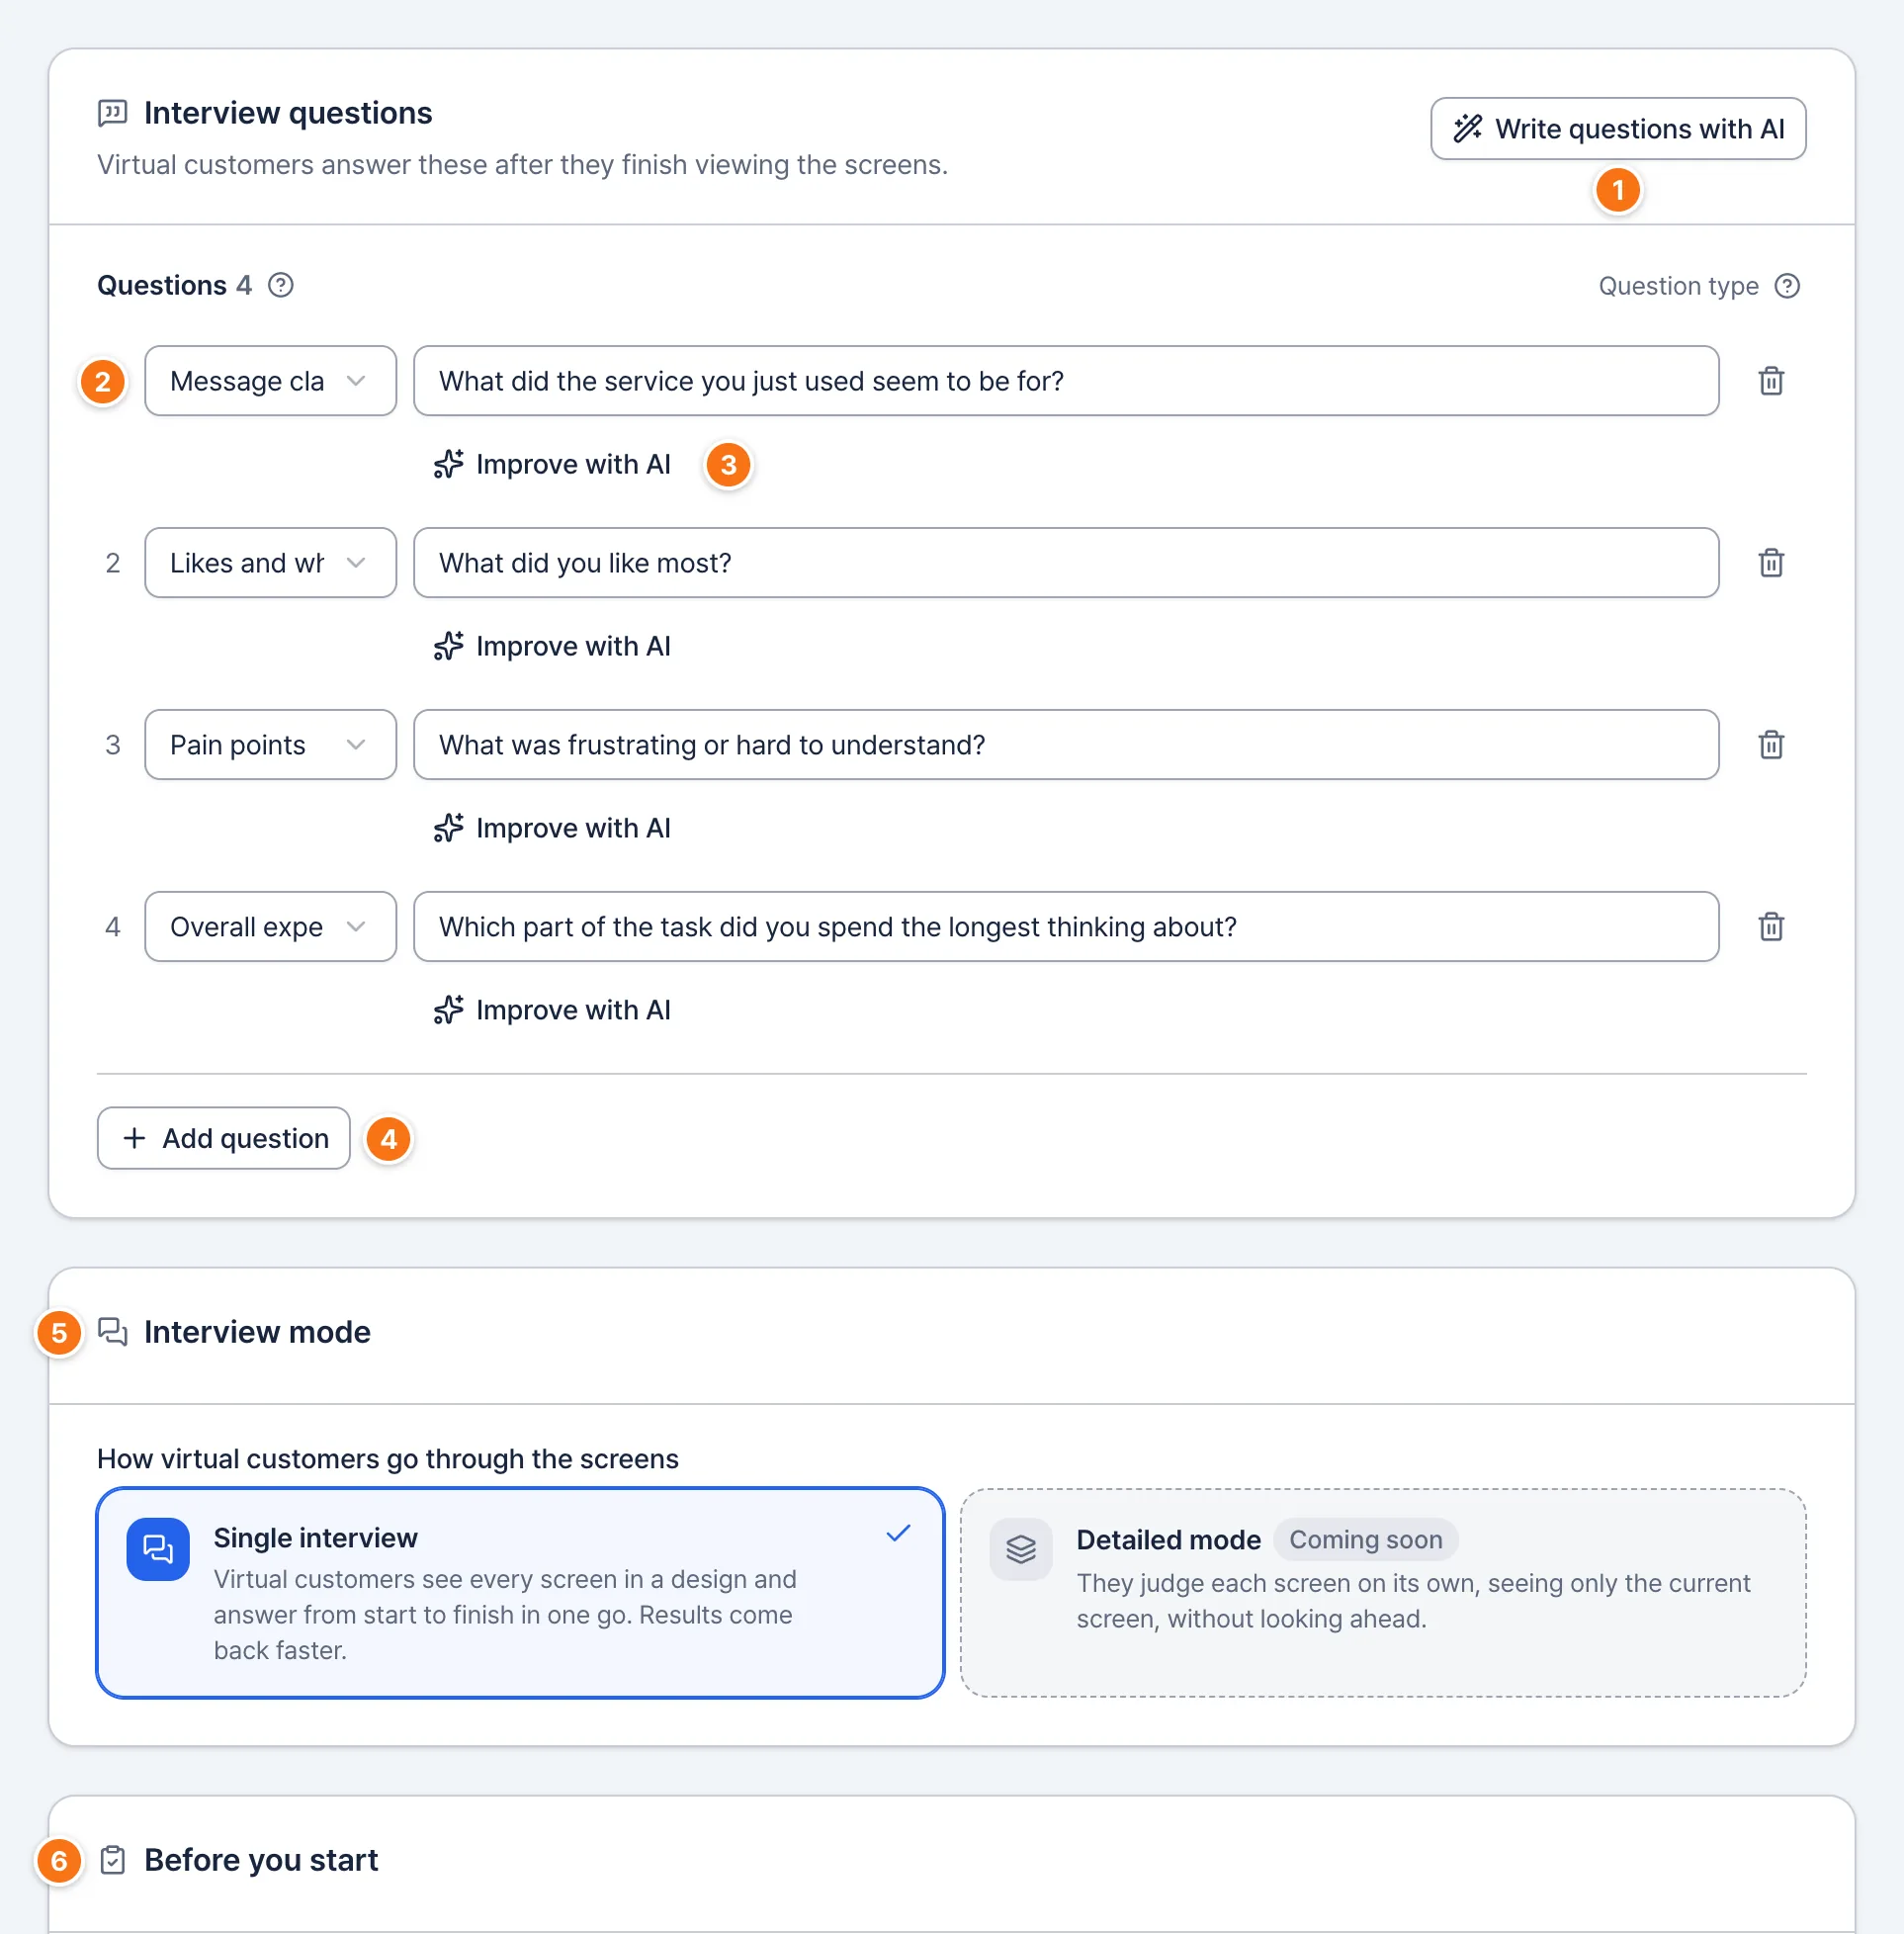
How to use
Write questions with AI
AI fills in questions that match your goal metrics.
Question type
What each question is for: message clarity, likes and why, pain points and so on.
Improve with AI
AI rewrites one question more clearly. If you don’t like it, select ‘Undo’.
Add question
Adds a question. Use the trash icon to delete one.
Interview mode
Virtual customers see all of a design’s screens and answer in one go (single interview).
Before you start
A last check of everything from step 1 to step 4.
Checkpoints
- If a question gives away the answer you want, you’ll see a warning.
- Anything missing shows in ‘Before you start’ and in ‘Next up’ at the bottom. Select it to jump there.
Virtual customers receive the confirmed briefing and your questions exactly as written.
Interview questions in an ads and content survey
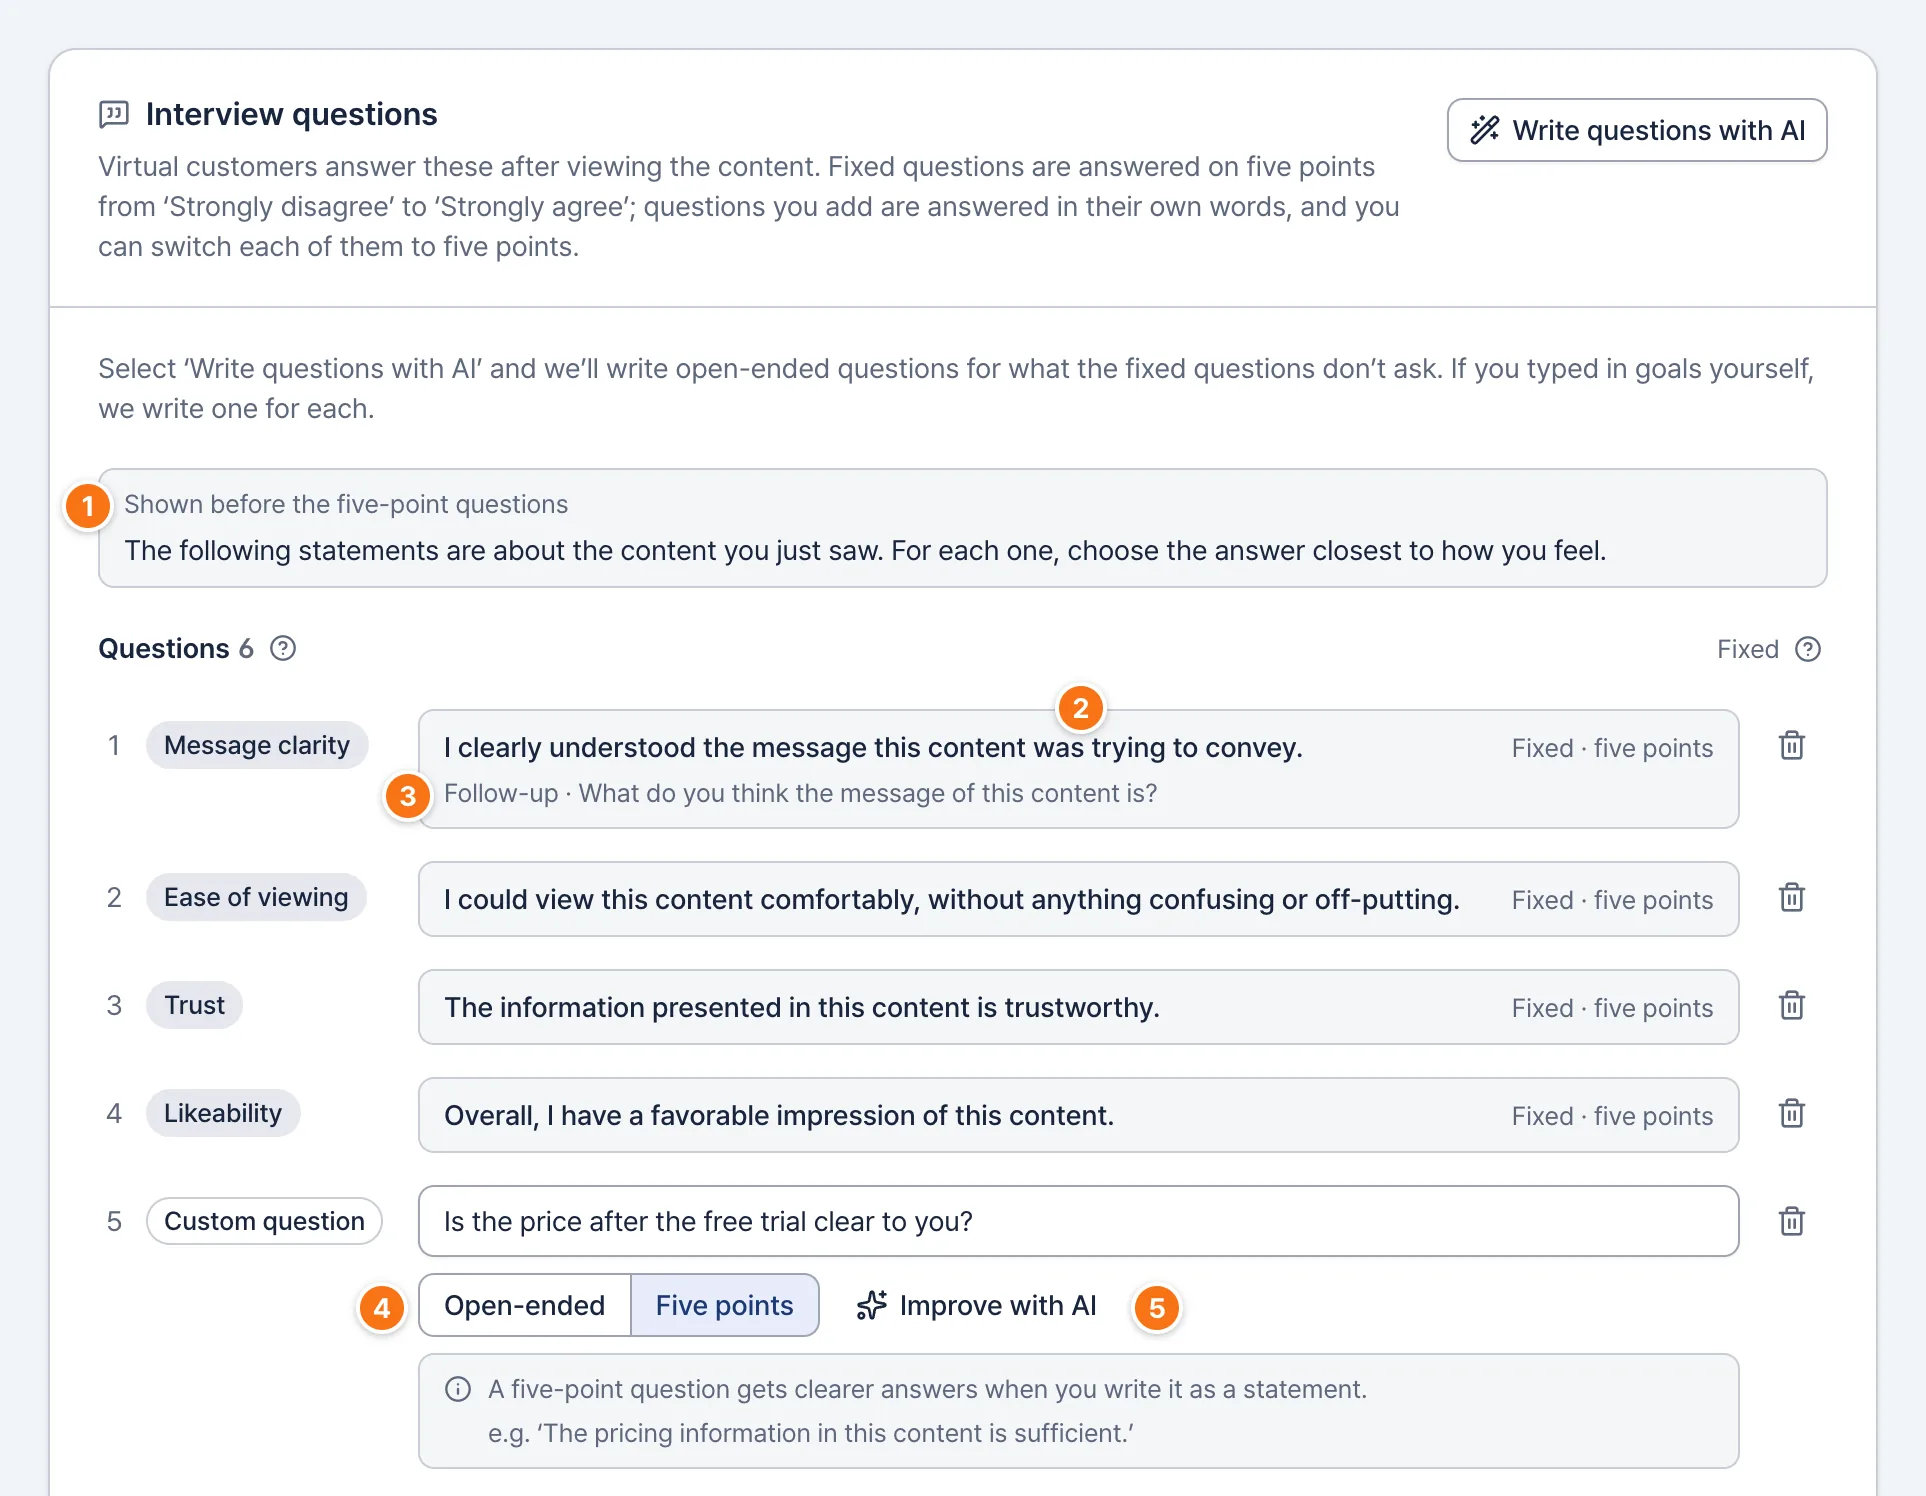
How to use
Shown before the five-point questions
What virtual customers see before the five-point questions.
Fixed questions
Message clarity, likeability and ease of viewing are in every ads and content survey; the rest are statements that come with the goals you chose in step 1. People answer on five points, from ‘Strongly disagree’ to ‘Strongly agree’. You can’t edit them, but you can delete them.
Follow-up
The message clarity and first impression questions also ask this, answered in their own words alongside the five points.
Open-ended · Five points
Questions you add are answered in people’s own words. Choose ‘Five points’ to have one answered on five points instead.
Improve with AI
AI rewrites one question: an open-ended one as an open question, a five-point one as a statement.
Checkpoints
- ‘Write questions with AI’ writes open-ended questions for what the fixed questions don’t ask. If you typed in goals yourself, it writes one for each.
- A five-point question gets clearer answers when you write it as a statement.
- You can put a deleted fixed question back from ‘Removed fixed questions’.
- The report’s ‘Results by question’ shows how many people chose Agree or higher on each five-point question, and the answers that came up most on each open-ended question.
Build a survey
Start and run the survey
Start the survey with ‘Start survey’ at the bottom of step 4, then follow its progress in step 5, Run the survey.
Start the survey
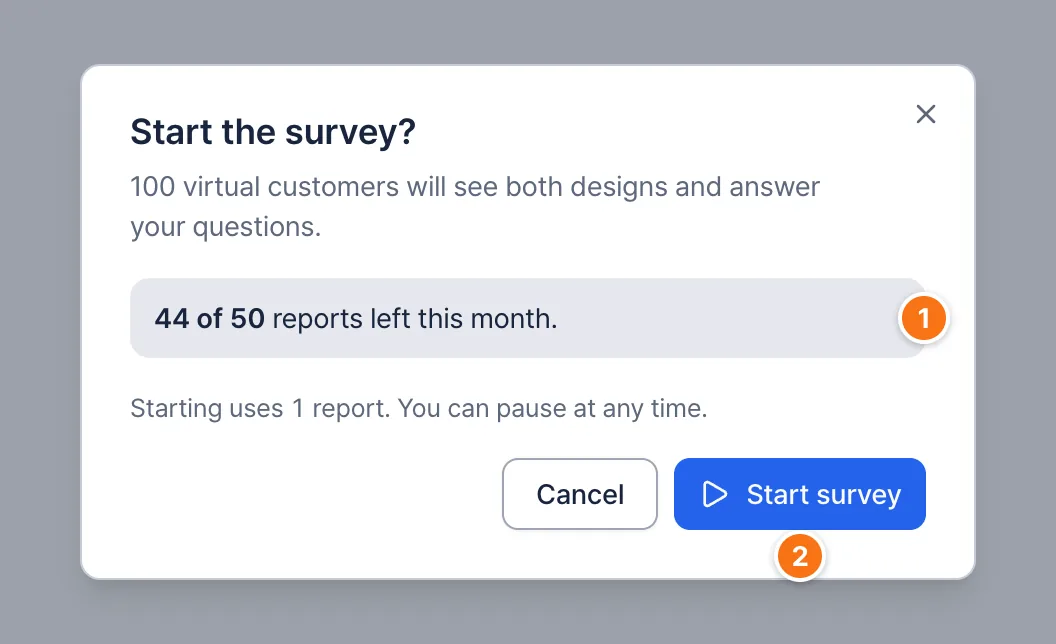
On this screen
Reports left
How many reports you can use this month. Starting uses 1 per 100 people.
Start survey
Starts the virtual customer interviews right away.
How to use
- Select ‘Start survey’ at the bottom of step 4.
- Check how many reports you have left this month, then start.
- Starting uses 1 report per 100 virtual customers and takes you to step 5, Run the survey.
Checkpoints
- If anything is missing, the dialog lists it. ‘Go to the first item’ takes you there.
- If you don’t have enough reports, you can’t start. The dialog shows when they refill and what you can do next.
- Edit steps 1–4 after starting and the button becomes ‘Start again’. Each restart uses 1 report per 100 virtual customers, and you can open the earlier report from Earlier reports in step 6.
- If the earlier survey stopped before it finished, starting again ends it first. If it got any answers, they become a report that counts toward your limit; if not, it won’t count.
Follow progress
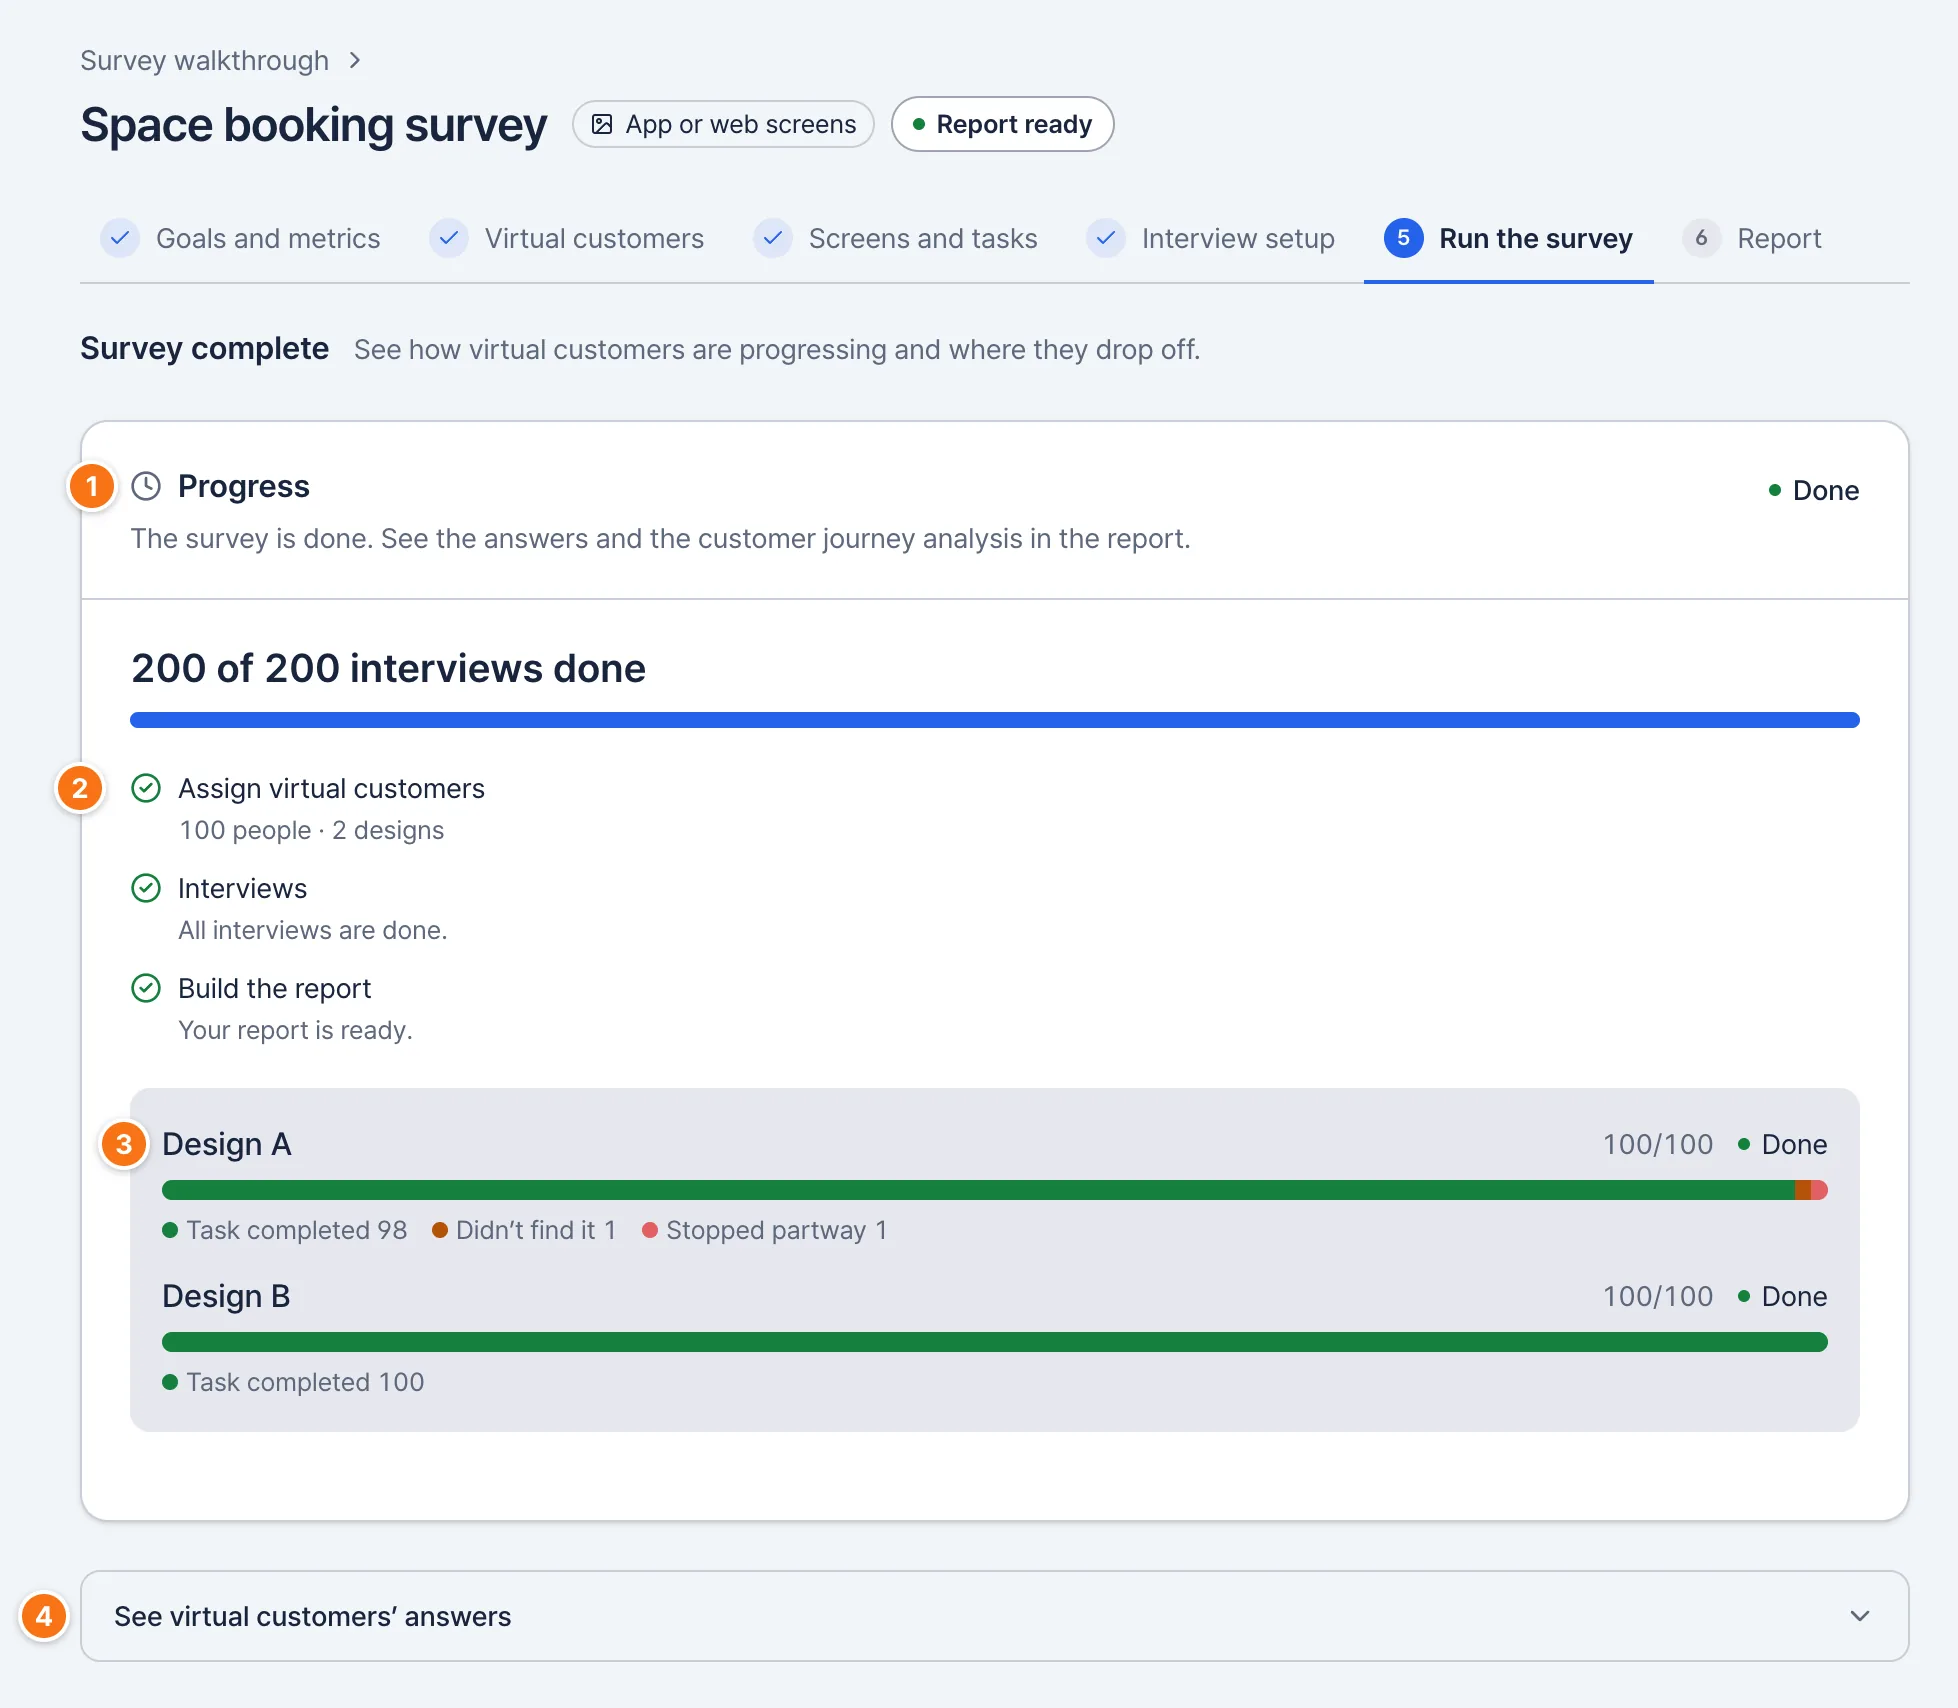
On this screen
Progress
Interviews done out of the total. The total is people × designs.
Stages
Assign virtual customers, interviews, building the report, then AI analysis.
Results by design
How many finished the task, didn’t find it, or stopped partway, by design.
See virtual customers’ answers
Open it to read answers as they arrive.
Checkpoints
- The survey keeps running if you close the page. Come back any time to pick up where you left off.
- Use ‘Pause’ to stop and ‘Continue’ to pick up where it stopped.
- ‘End here’ cancels the remaining interviews and can’t be undone. Answers already in are kept in the report. To run it again, edit steps 1–4 and select ‘Start again’.
- When it’s done, select ‘Next’ at the bottom to go to step 6, Report.
Read the results
Read the report
Read step 6, Report, in this order to go from the conclusion to the evidence behind it.
Summary and designs
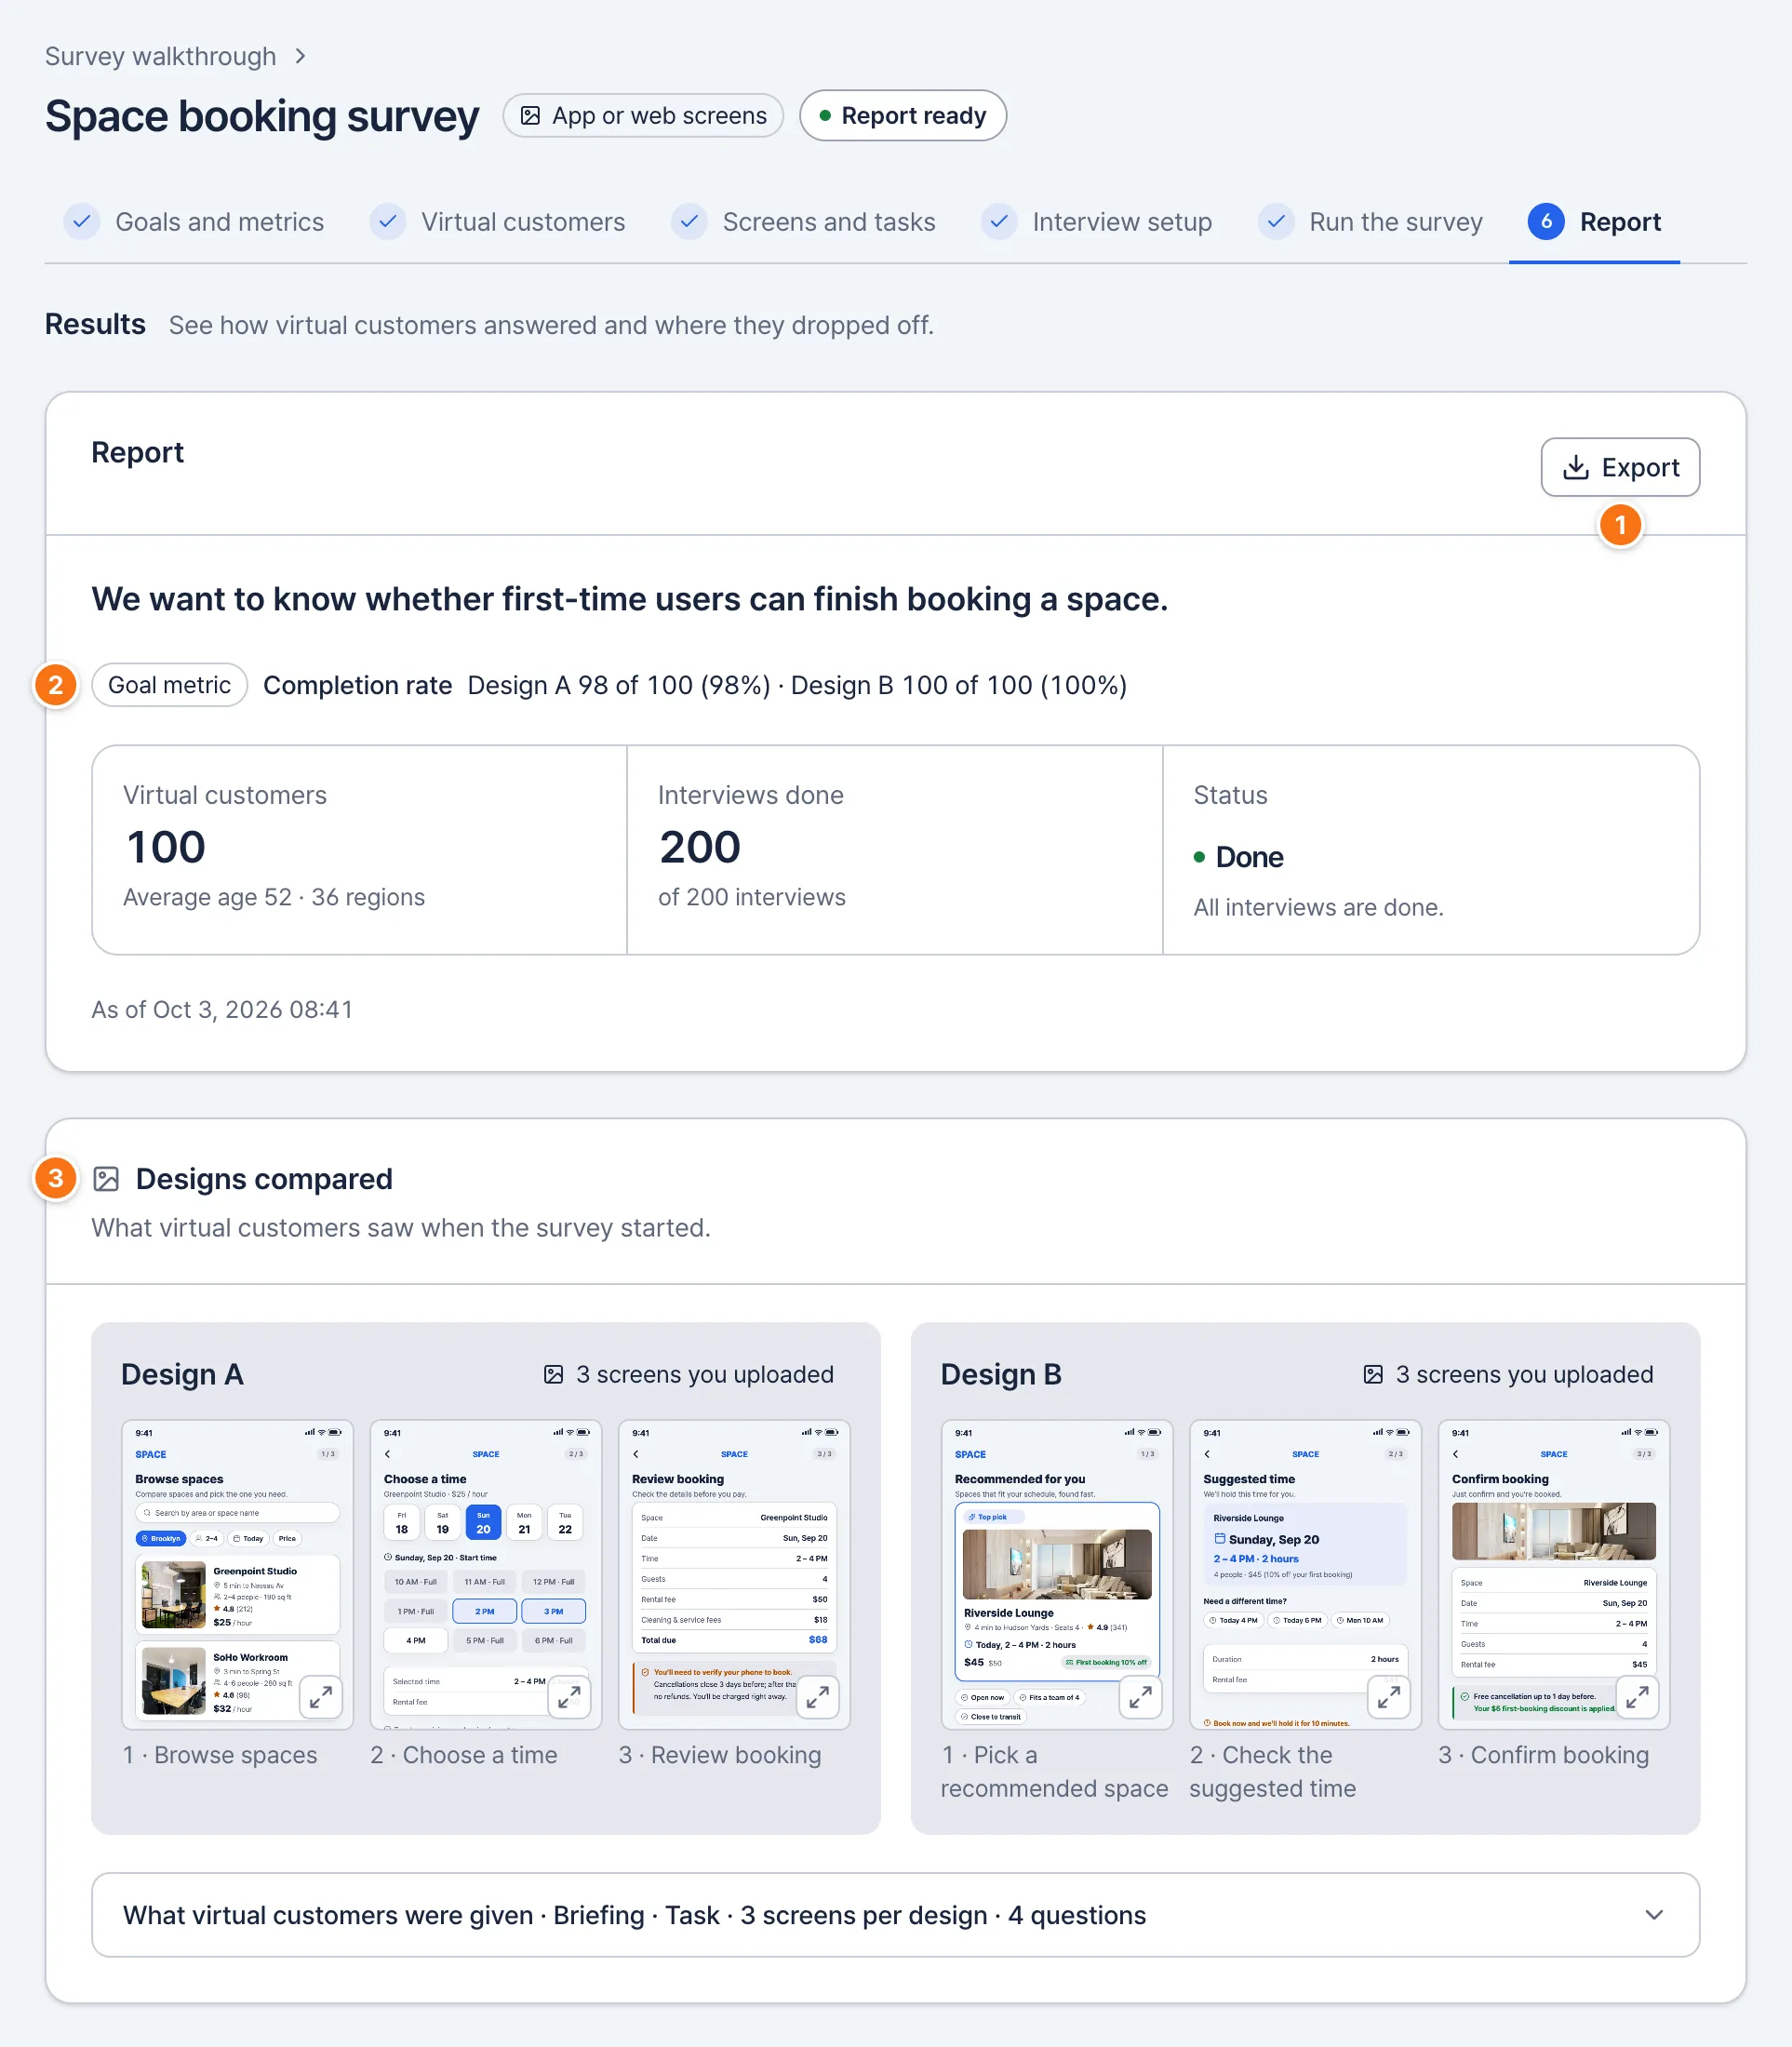
On this screen
Export
Saves the report as a file. In your own surveys it sits at the right of the survey title.
Summary
Goal metrics, number of virtual customers and interviews done.
Designs compared
The screens used when the survey started and what virtual customers were given.
Checkpoints
- Once the report is ready, AI analysis (overall take, reaction themes, suggestions) follows. It keeps going if you close the page.
- Editing steps 1–4 after starting doesn’t change ‘Designs compared’ (‘Design shown’ with one design). It still shows the designs used when the survey started.
- An ads and content survey’s report also has ‘Results by question’. Select a five-point question to see how the answers spread across the five levels, and why.
1. Overall take: the conclusion
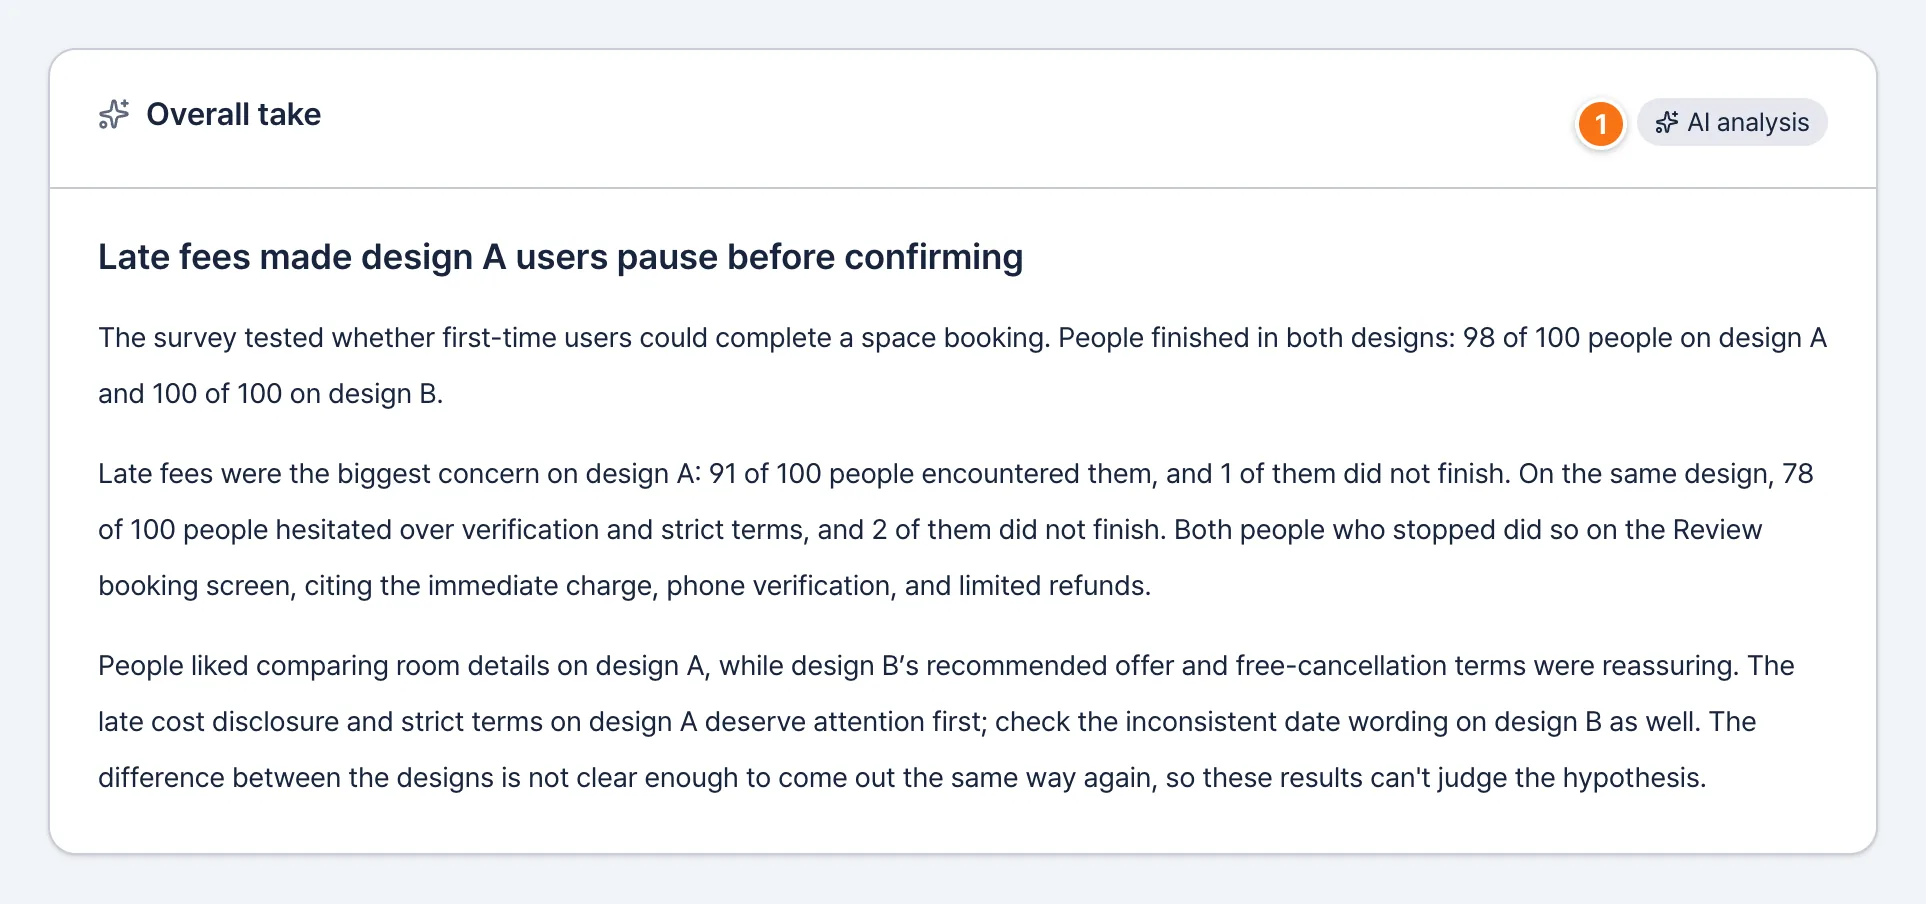
On this screen
AI analysis
The top line is the conclusion. Below it: the biggest obstacle, the verdict on your hypothesis, and what to fix.
2. Comparison: the difference
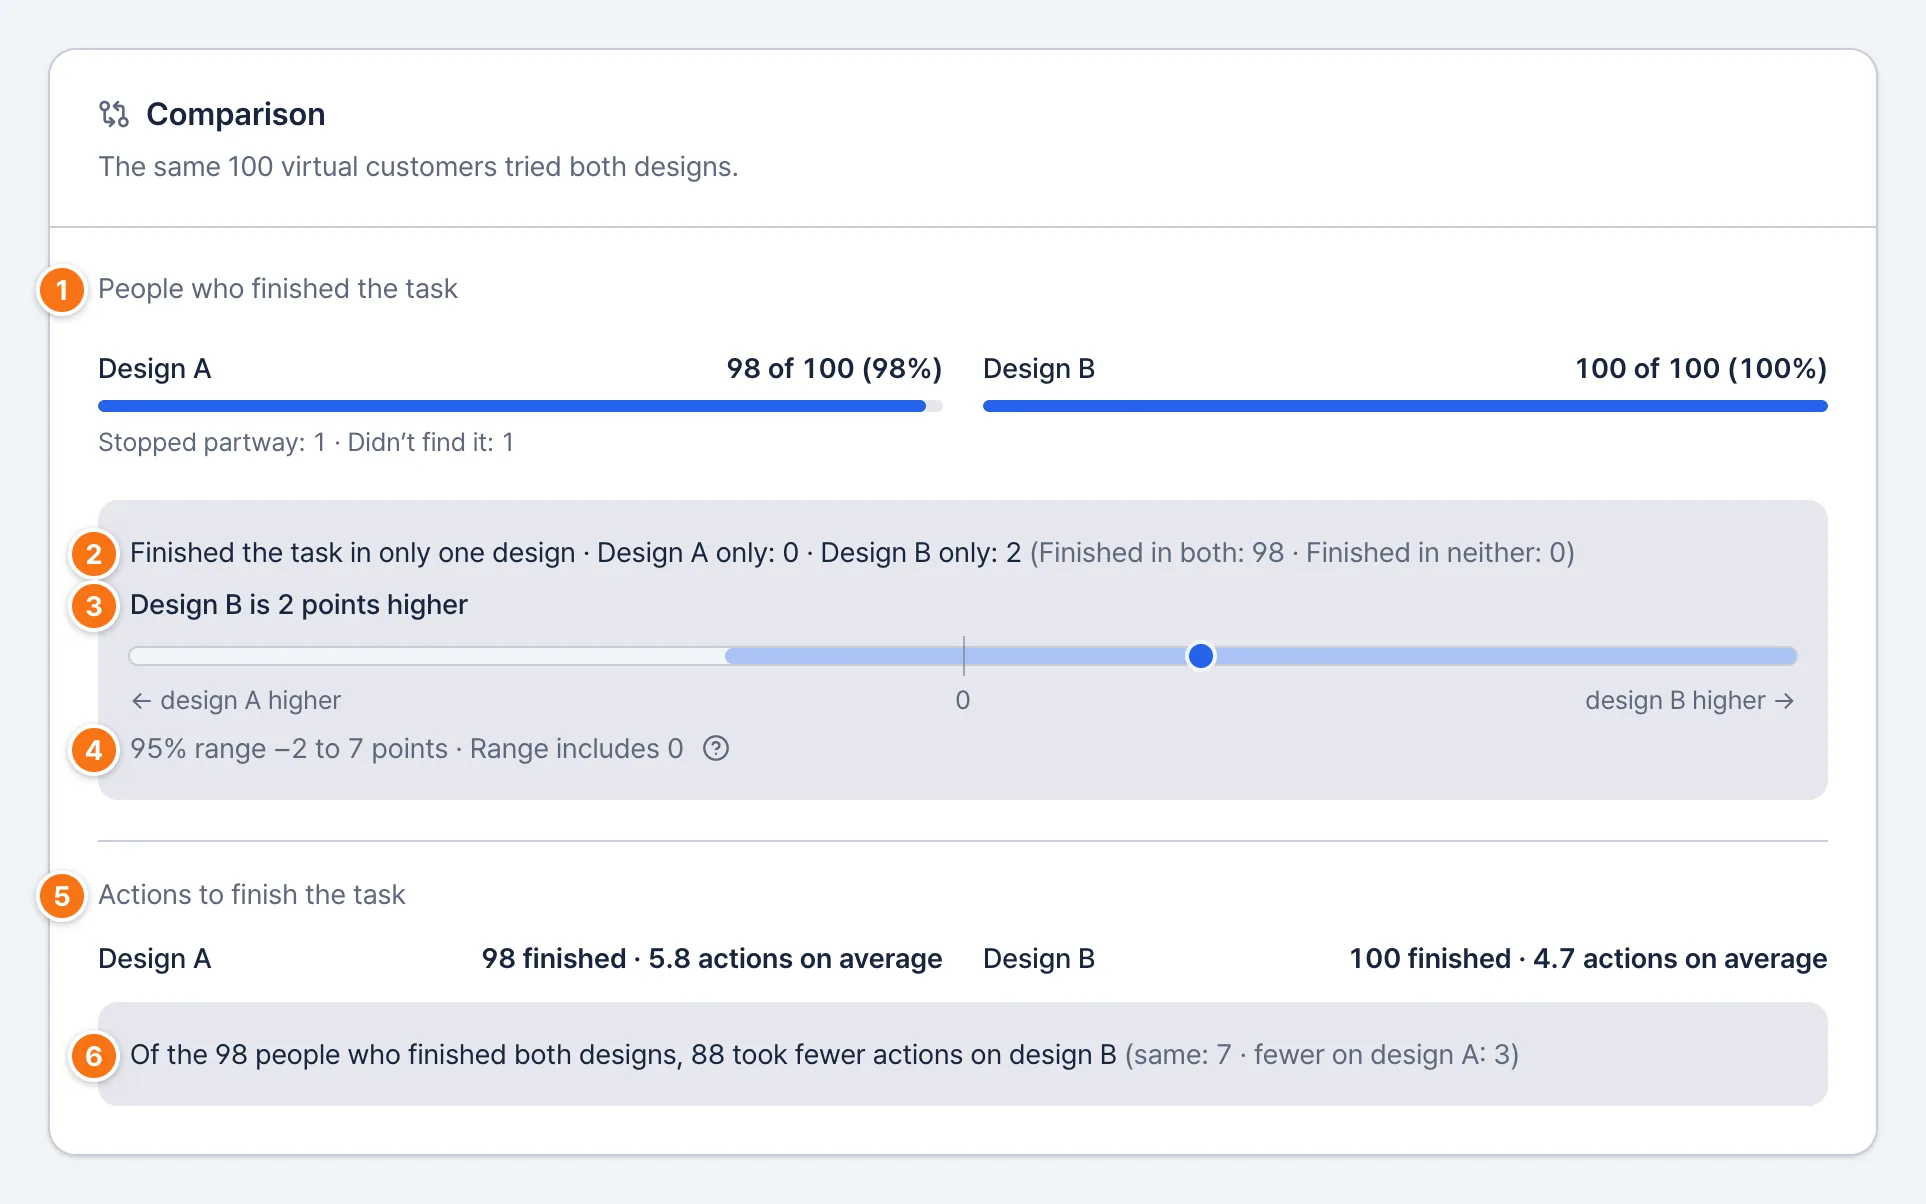
On this screen
People who finished the task
Out of everyone, how many finished the task in each design.
Finished the task in only one design
Everyone tried both designs, so the difference between them comes from these people.
Difference
The gap between the two designs’ rates, in percentage points.
95% range
Where the difference likely falls. If the range includes 0, there may be no real difference.
Actions to finish the task
For each design, the average number of actions people chose before finishing, counting only people who finished. If the number who finished differs by design, it says how many each average covers.
People who finished both designs
Among the same people who finished both designs, how many took fewer actions on each design.
3. Reaction themes: the reasons
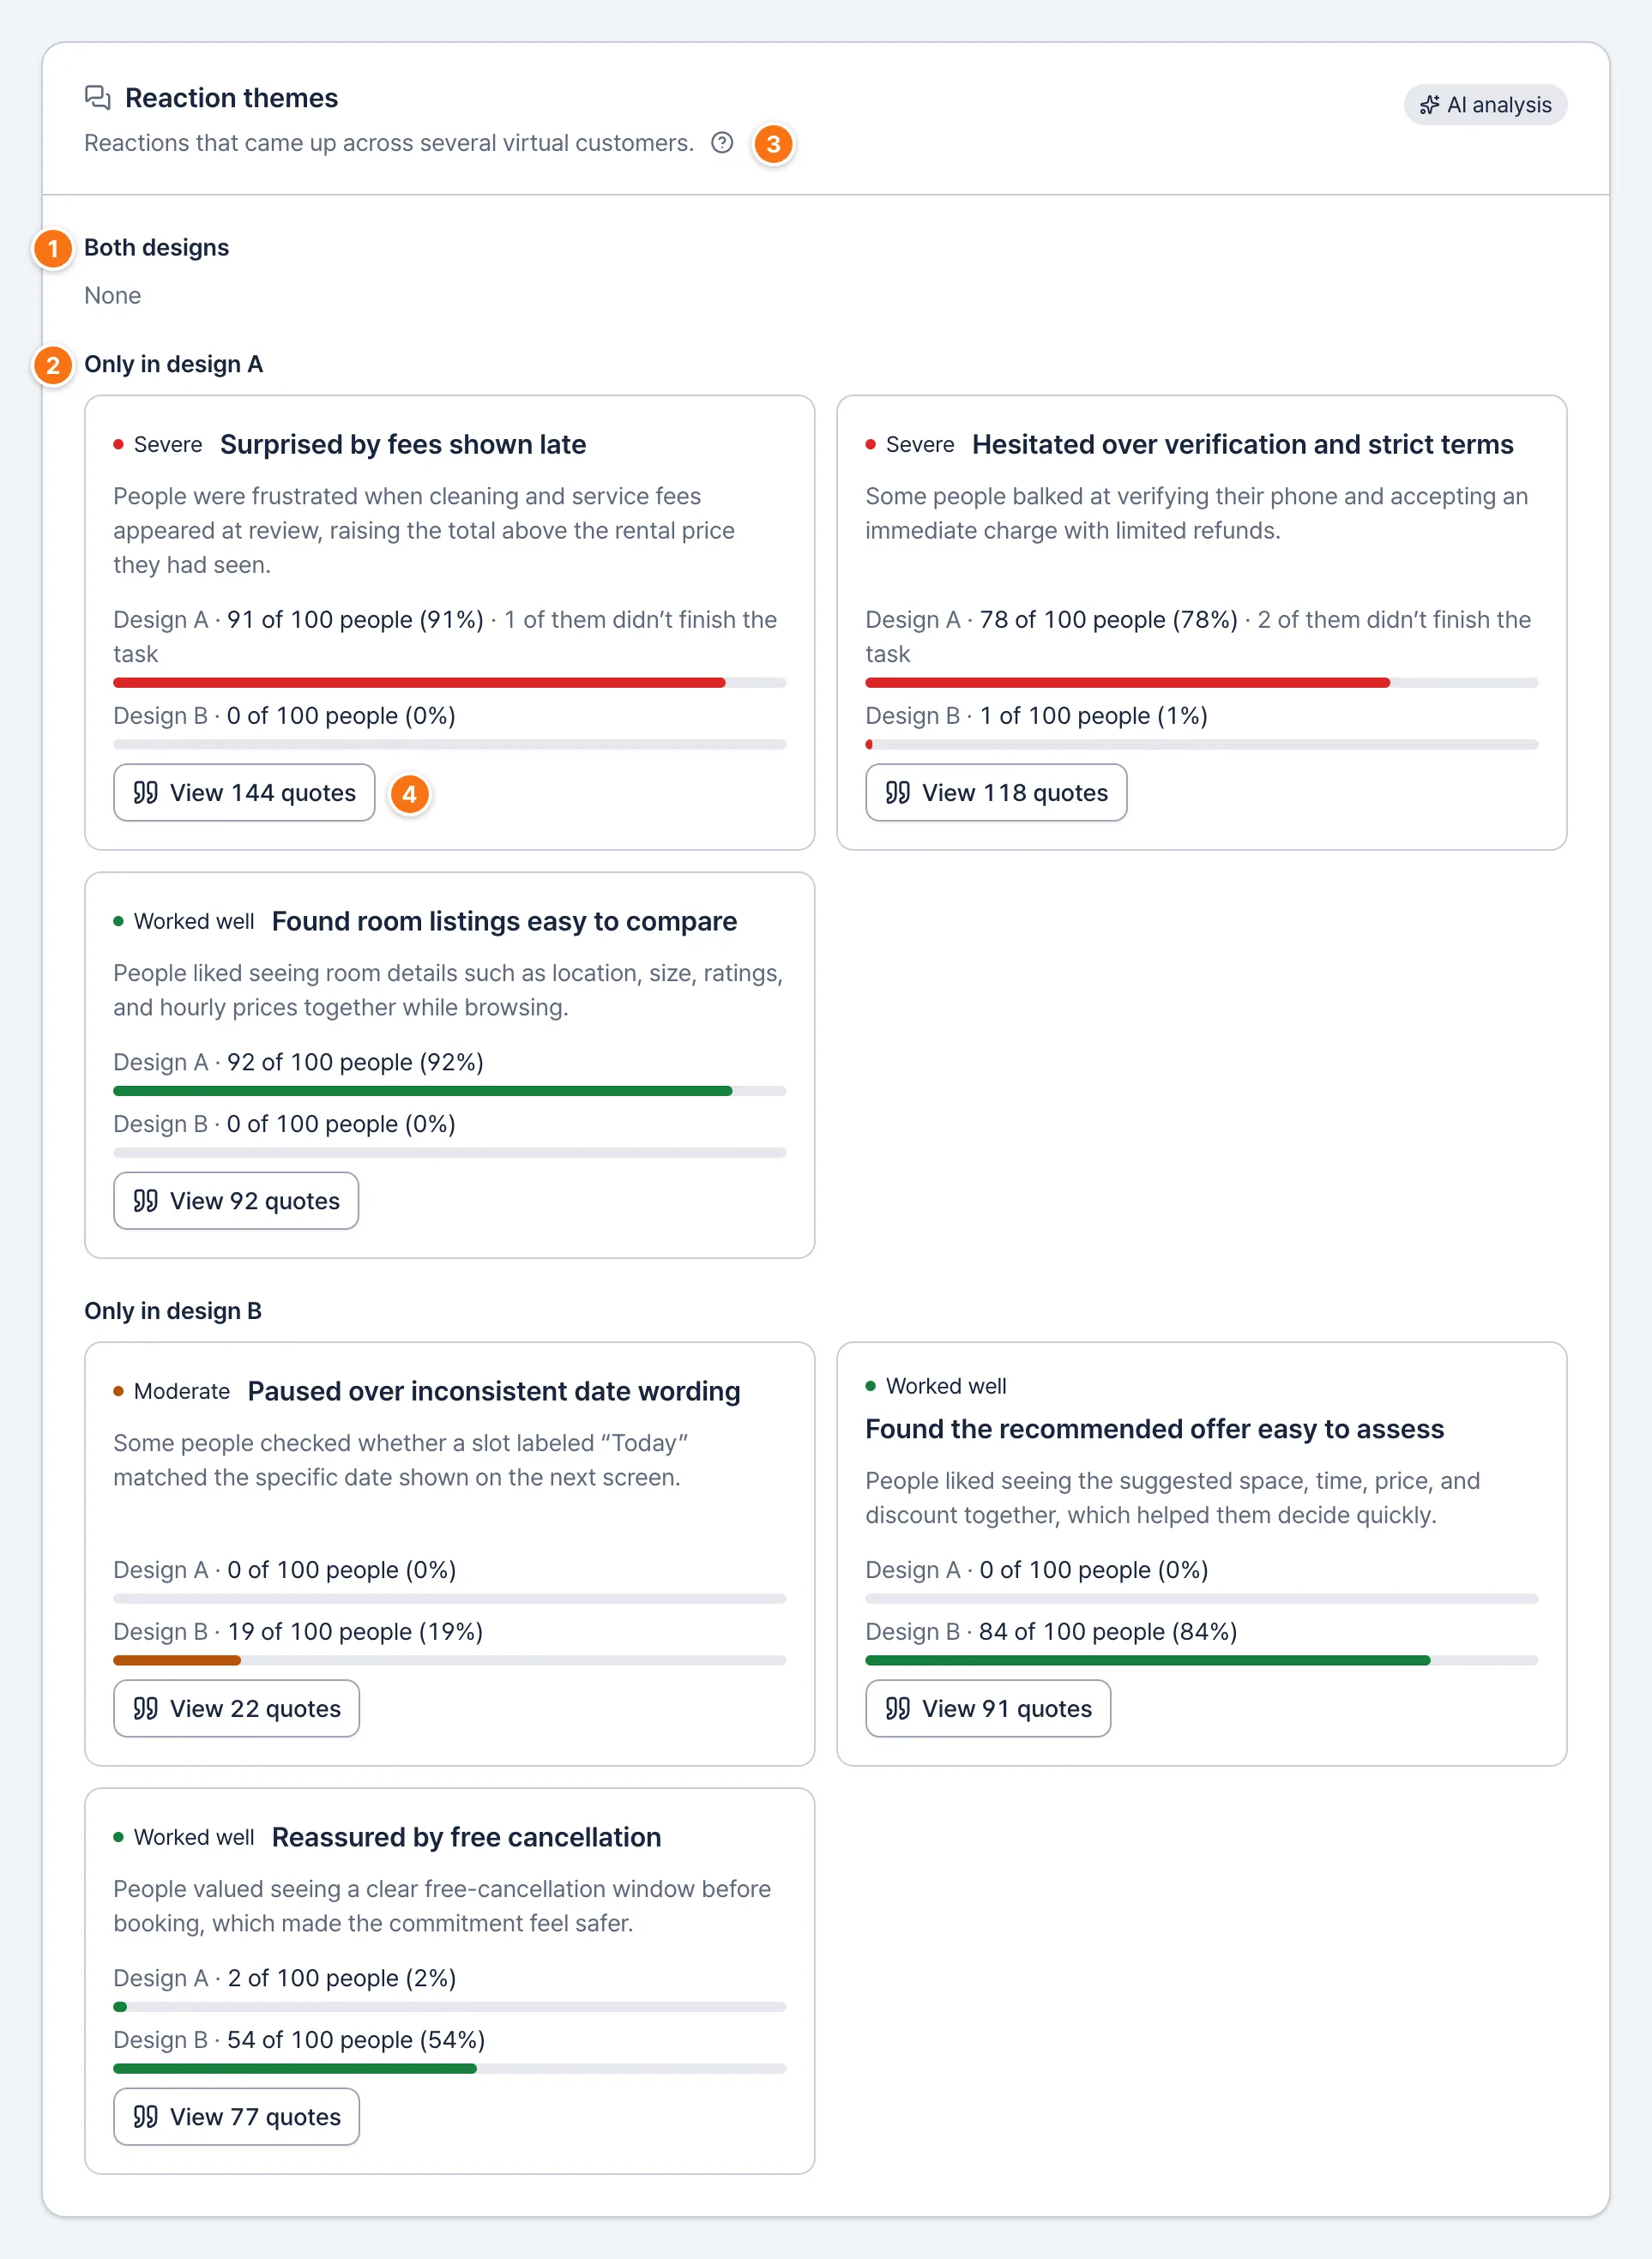
On this screen
Both designs
Reactions that came up in both designs.
Only in design A
Reactions that came up in one design only. Start here to see why the results differ.
About severity
How problems are rated severe, moderate or minor.
View quotes
The answers behind the theme, word for word.
4. Customer journey: where people drop off
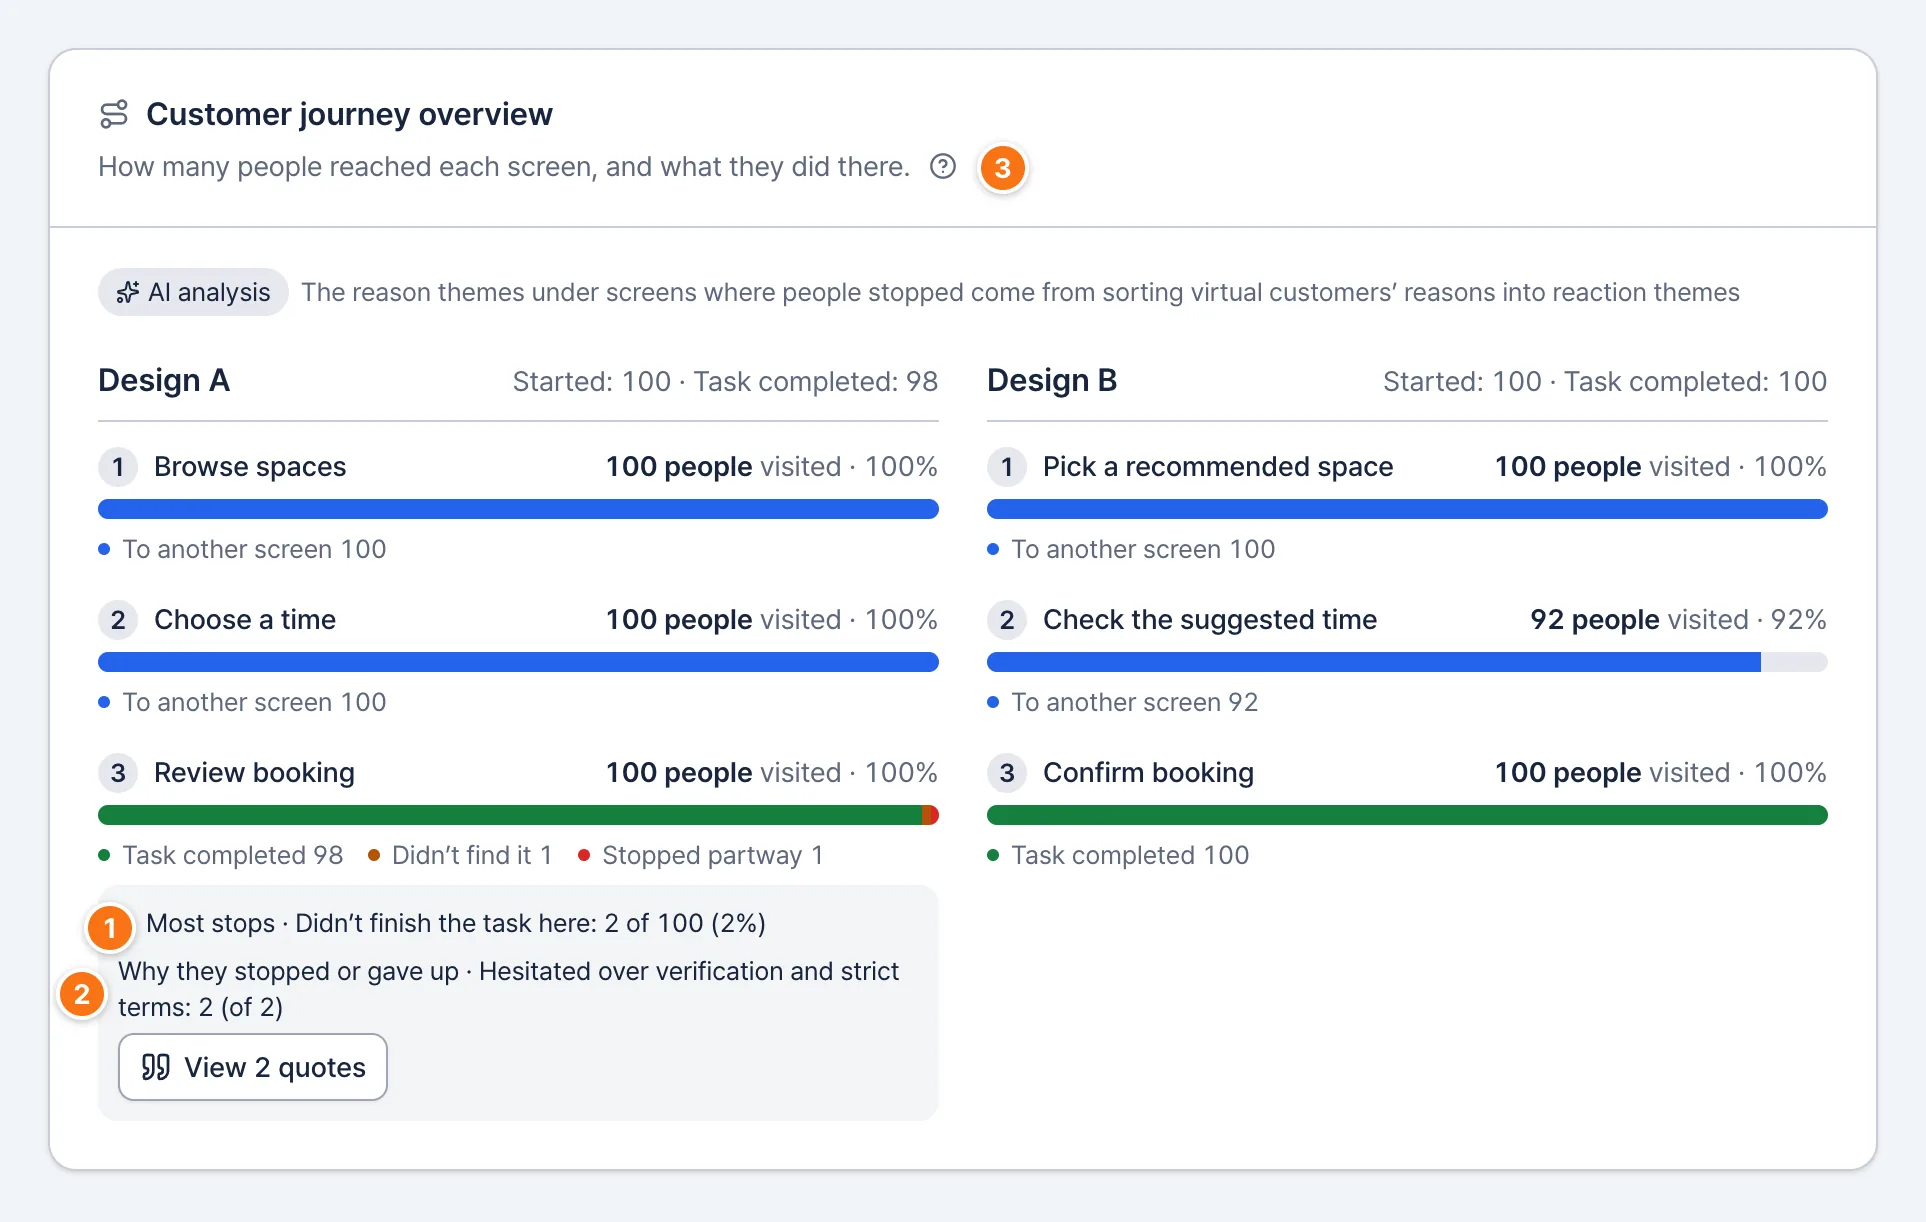
On this screen
Most stops
The screen where the most people stopped partway.
Why they stopped or gave up
The reasons people gave when they stopped or gave up on that screen, sorted into reaction themes.
How to read the bars
Each bar is a screen. The colors show what people did there.
5. Suggestions: what to do next
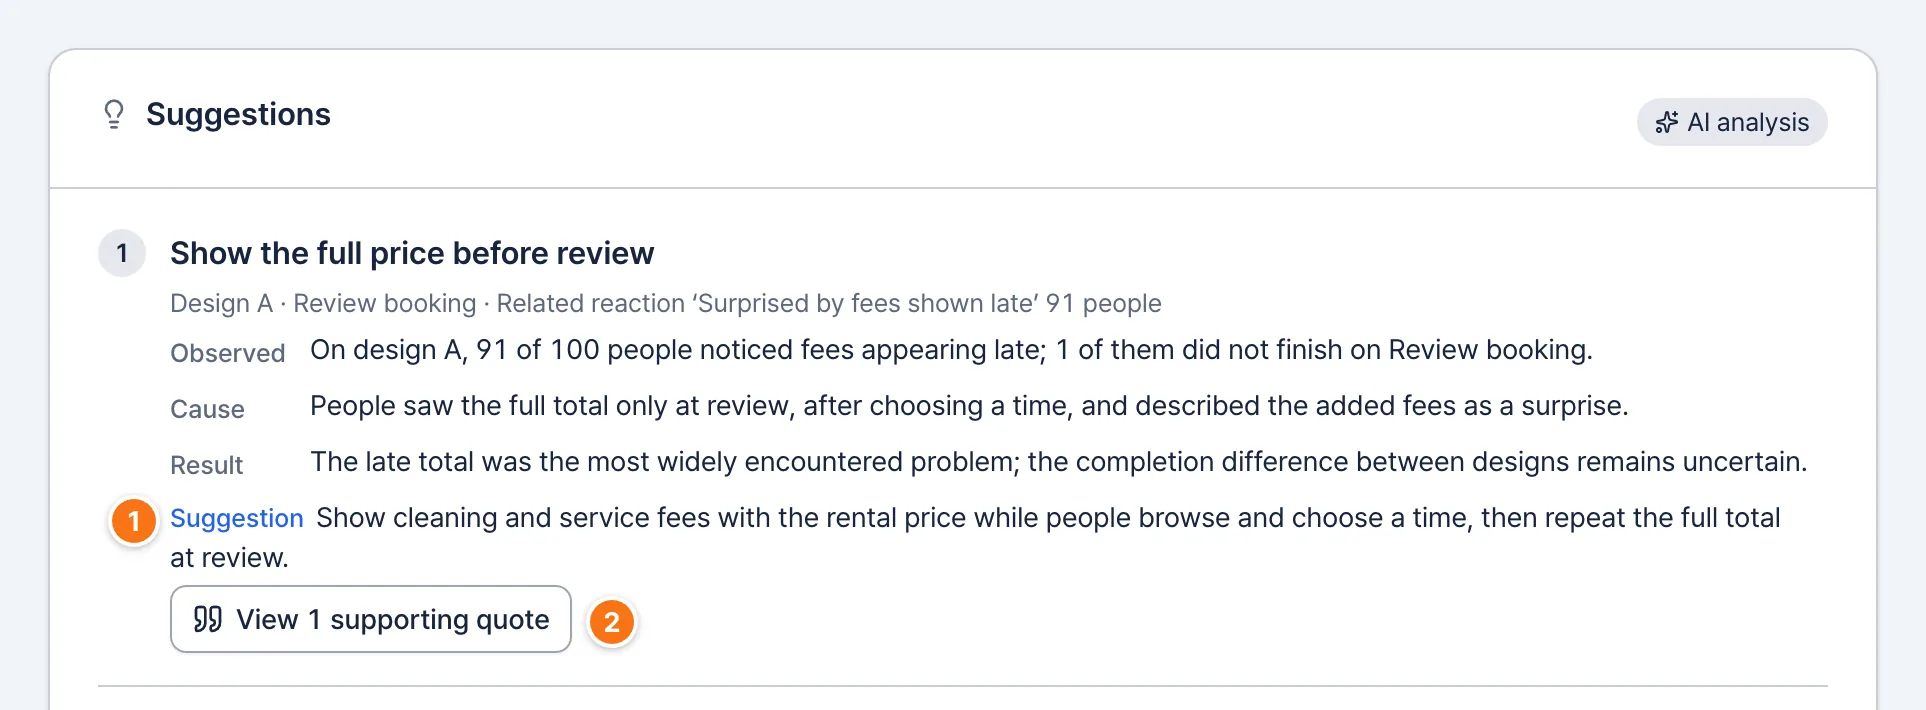
On this screen
Suggestion
What to change. The observation, cause and result above it are the evidence.
View supporting quotes
The answers the suggestion is based on.
6. Virtual customer answers: the source
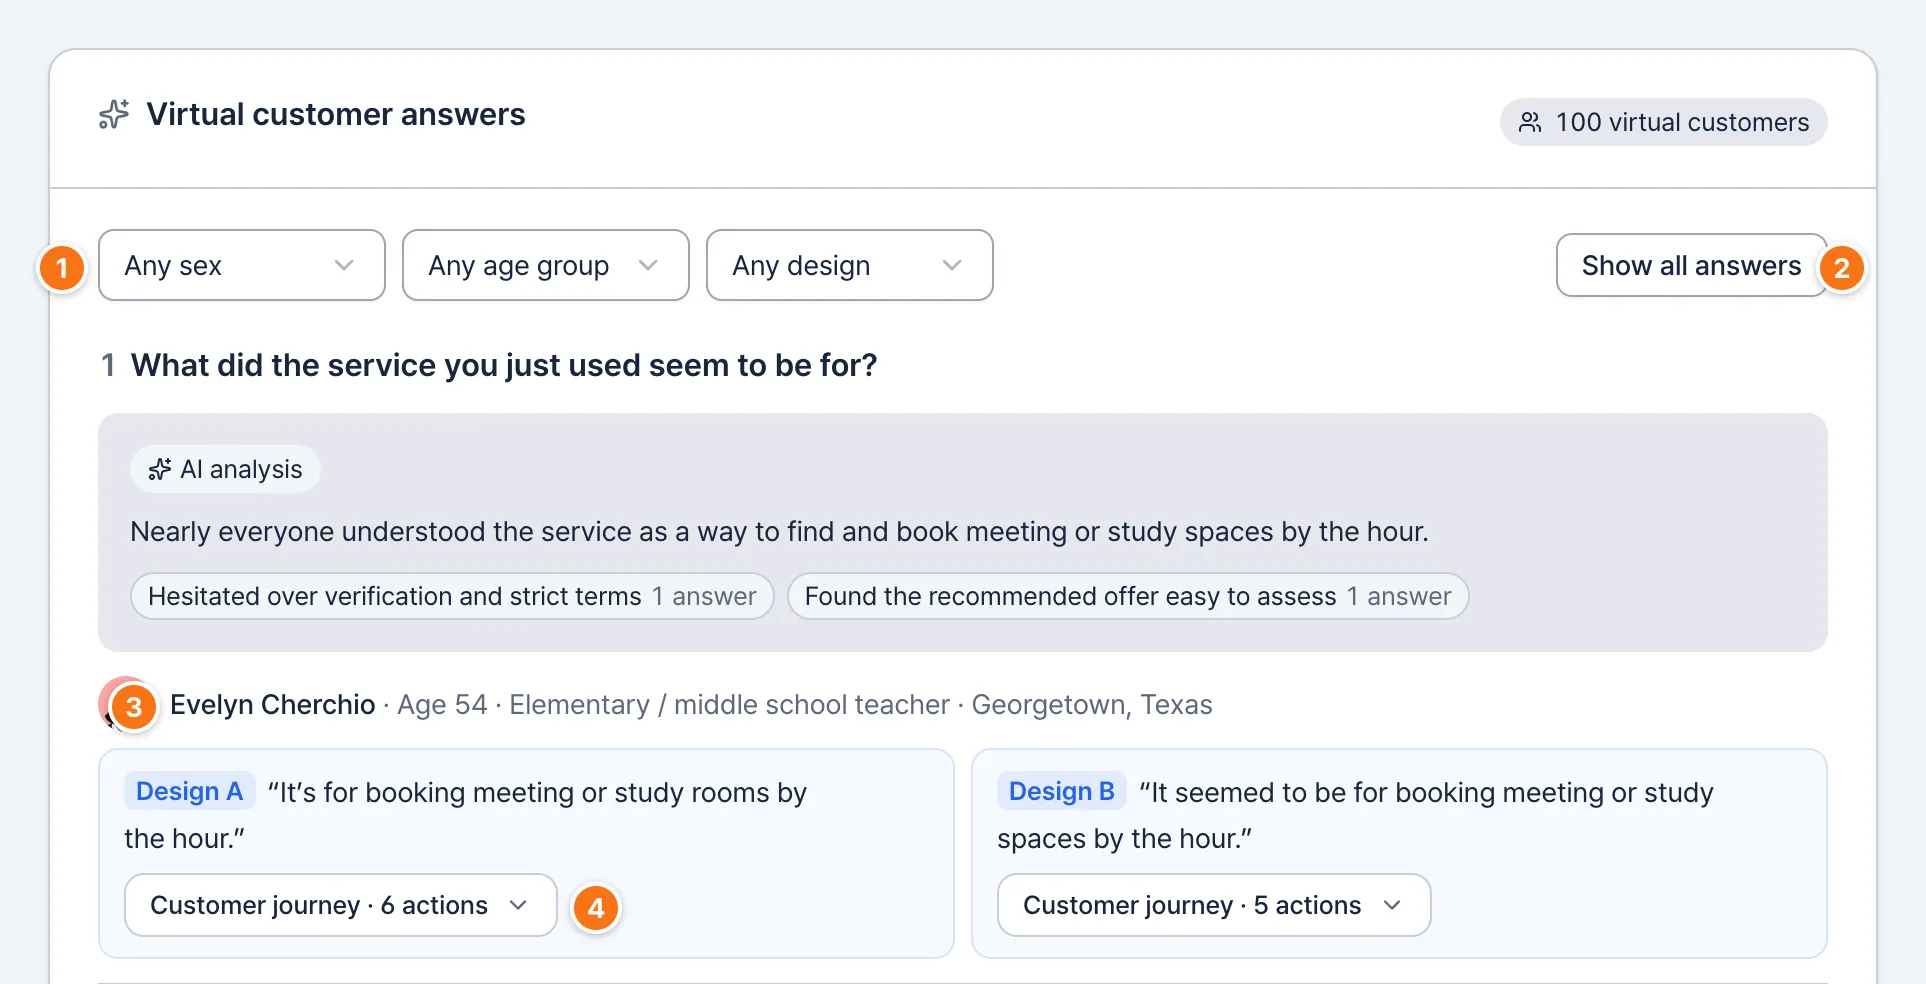
On this screen
Filters
Filter answers by sex, age group and design.
Show all answers
Opens every answer that’s collapsed under each question.
One virtual customer
Who they are and their answer for each design. ‘Didn’t reach this question’ means their interview was still in progress, ended with an error or was cancelled before the questions, and that status shows below it. People who stopped during the task still answer the questions.
Customer journey
Open it to see the screens this virtual customer saw and the actions they chose before answering, in order. ‘6 actions’ next to it is how many actions they chose during the task.
Checkpoints
- Choose a filter and only that group’s answers remain. The count at the top changes too, for example “50 of 100 people”.
- Compare designs by metric under ‘Metric impact’, and by country, sex and age under ‘Reactions by demographic’.
Earlier reports
How to use
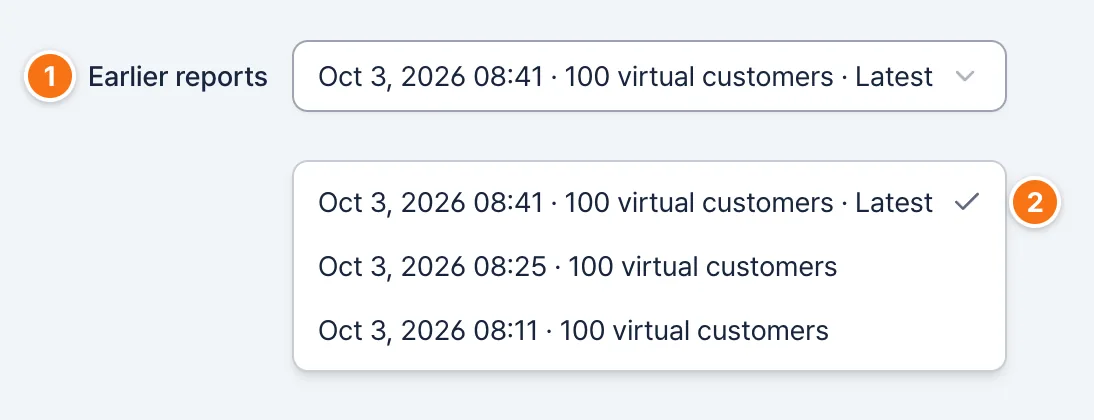
Earlier reports
Open the list above the report in step 6.
Latest
Choose a report. Each report shows when it was made and its number of virtual customers.
Checkpoints
- ‘Earlier reports’ appears only after you start the survey again and an earlier report exists.
- The most recent one is marked ‘Latest’.
Read the results
Export the report
Save the report as a file to share with your team.
How to use
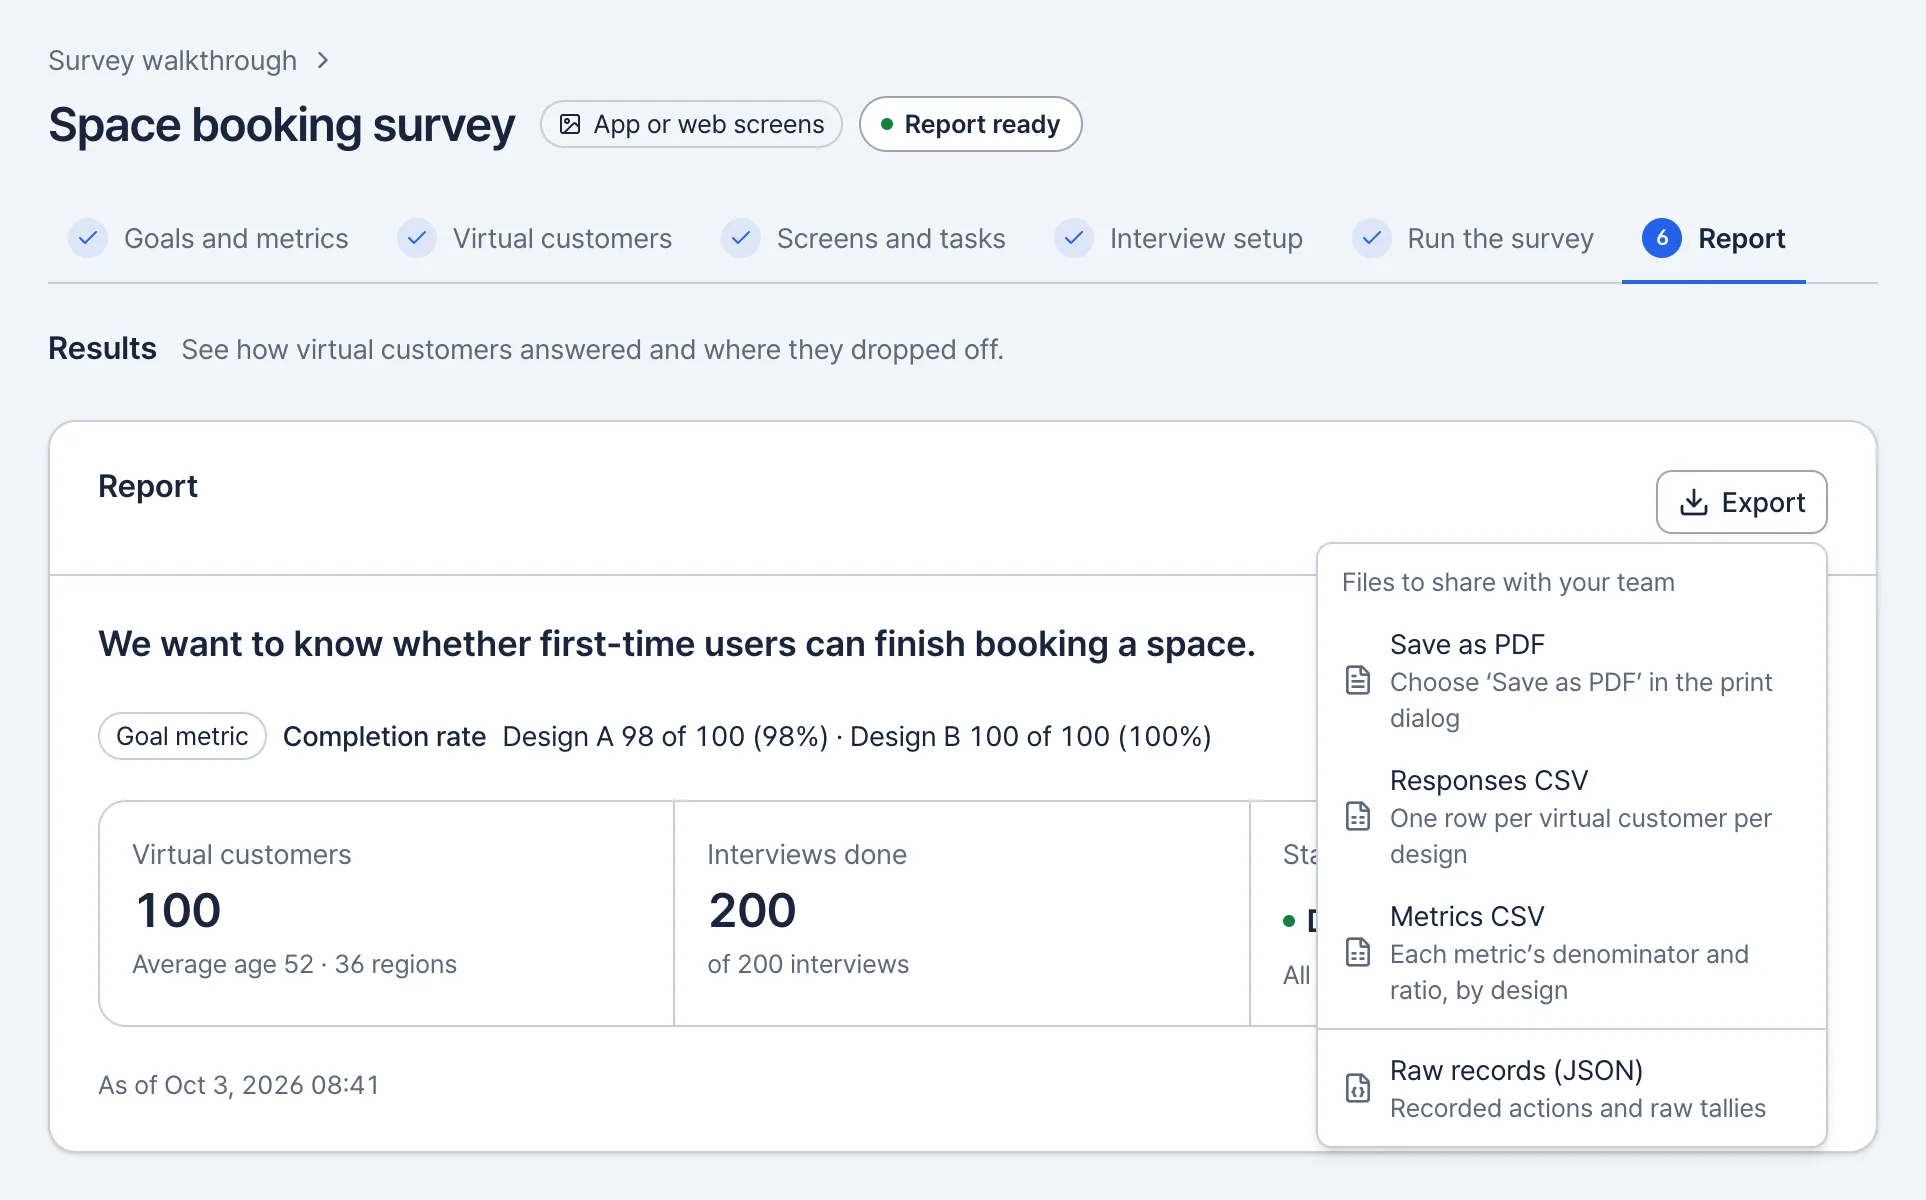
- Select ‘Export’ on the report.
- Choose a format. For a PDF, choose ‘Save as PDF’ in the print dialog.
Checkpoints
- Responses CSV has one row per virtual customer per design. Metrics CSV has each metric’s denominator and ratio, and the comparison between designs.
- In a screen-flow survey where someone finished the task, Metrics CSV also has each design’s average ‘Actions to finish the task’.
- Raw records (JSON) holds the virtual customers’ recorded actions and the raw tallies. It doesn’t include the designs or the question text.
- The PDF shows when the report was generated, and who exported it and when.
Usage and your team
Check usage and team details under ‘Reports this month’ or ‘Settings’ at the bottom of the left menu.
Plan and usage
On this screen
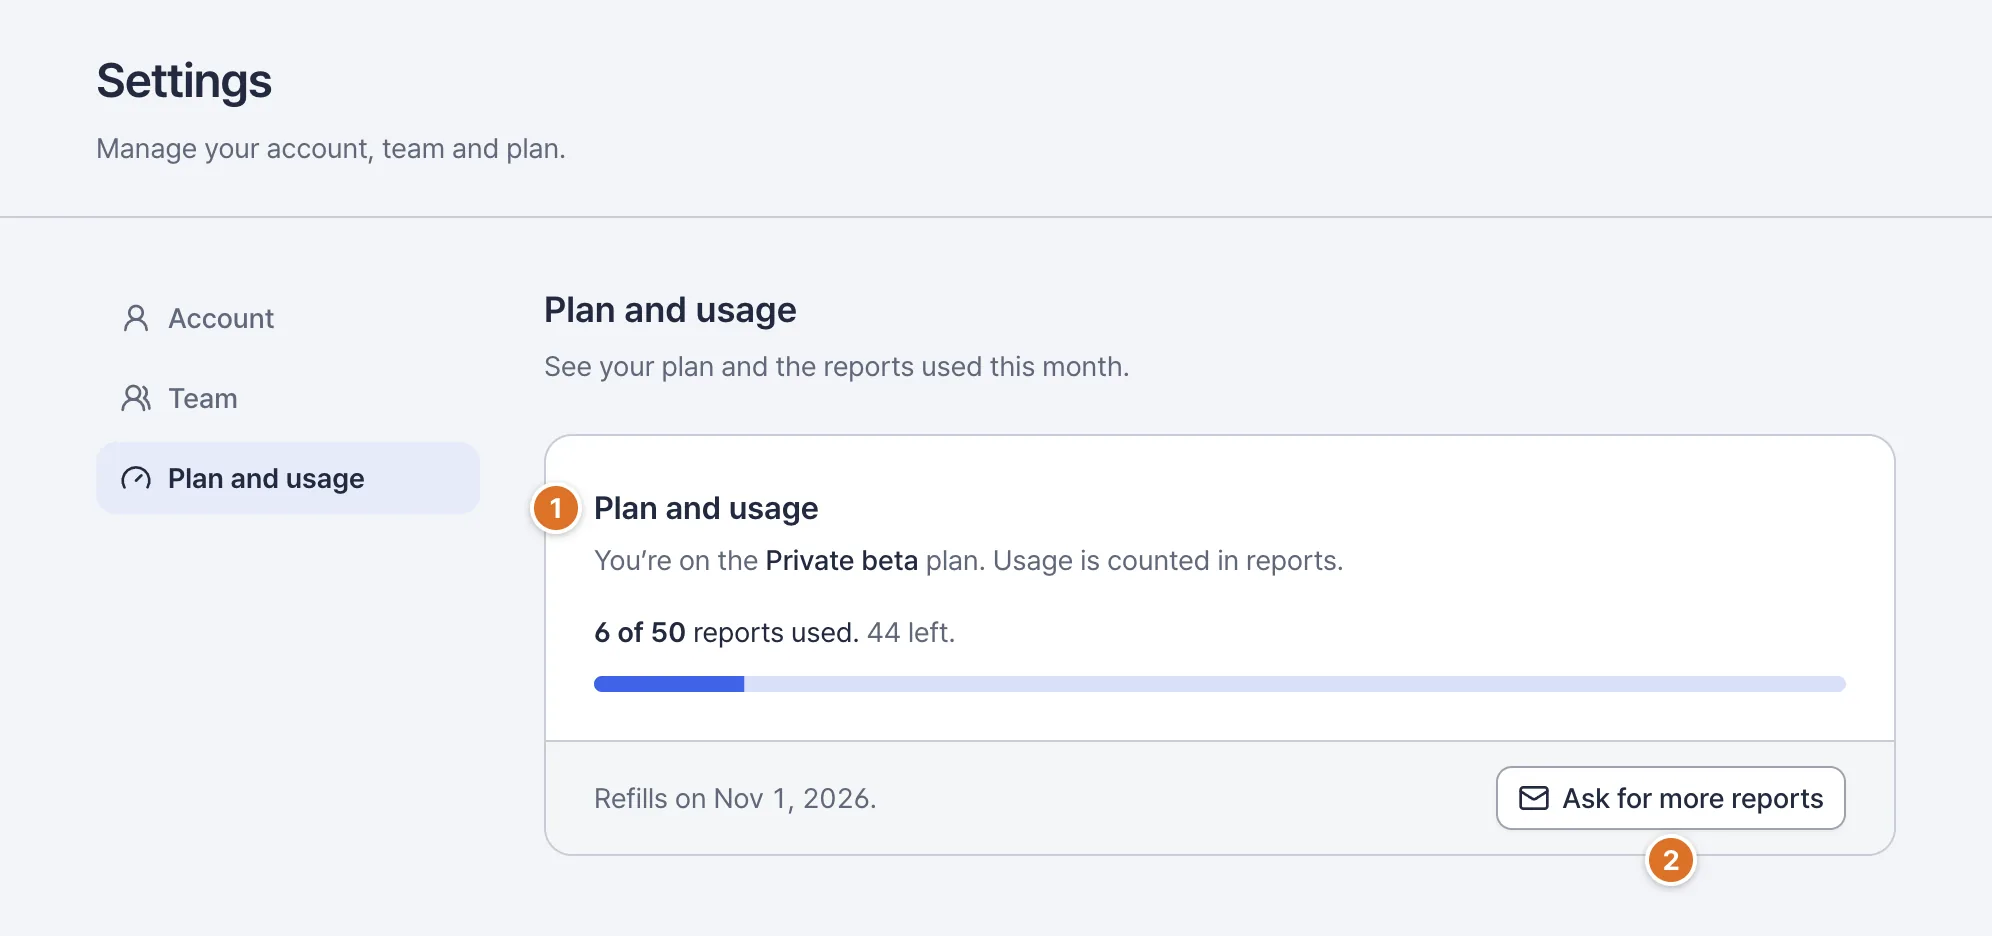
Plan and usage
Your plan, reports and add-on reports left this month, and your next payment date.
Ask for more reports
Get in touch if you need more reports.
Checkpoints
- Every time you start or restart a survey, 1 report is used per 100 virtual customers, however many designs it has.
- Teams that sign up get 3 free reports every month. Need more? Use See plans to move to Pro or Team.
Team settings
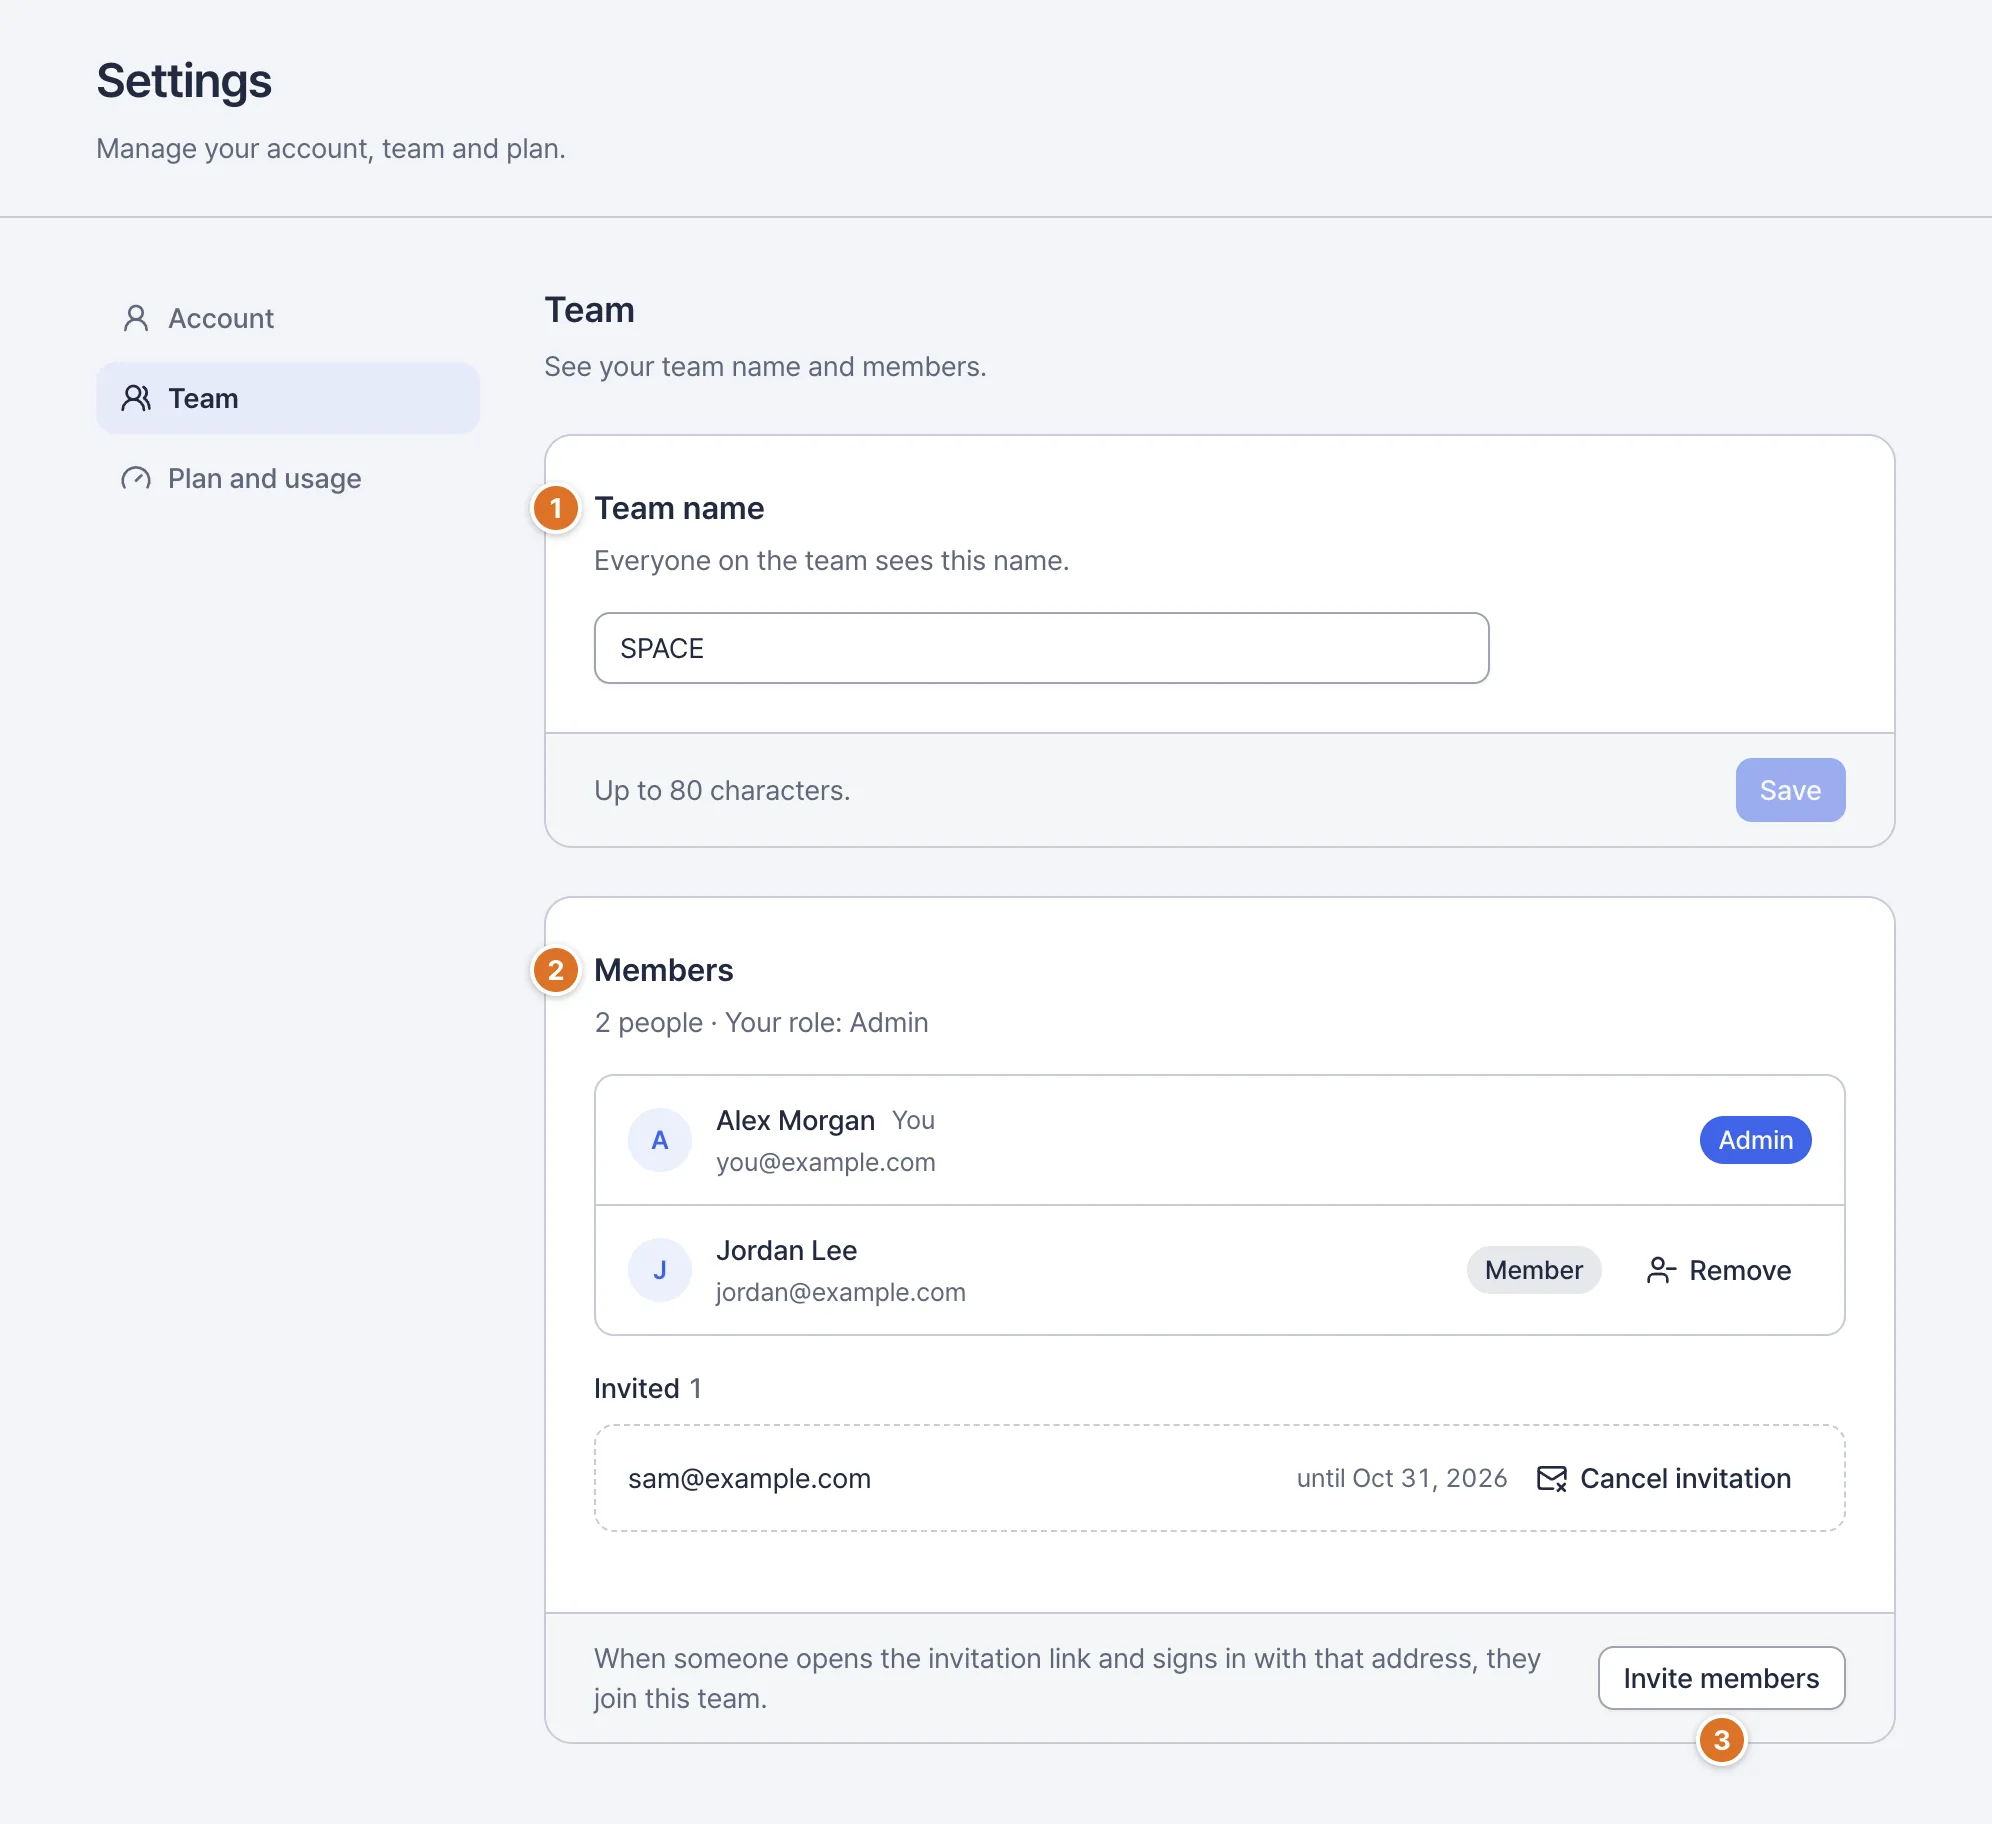
On this screen
Team name
The name everyone on your team sees. Only admins can change it.
Members
Who’s on the team and their role (admin or member).
Invite members
A team admin enters an email and the invitation goes out right away. Once they open the link and sign in with that address, they’re a member.
Cancel invitations and remove members
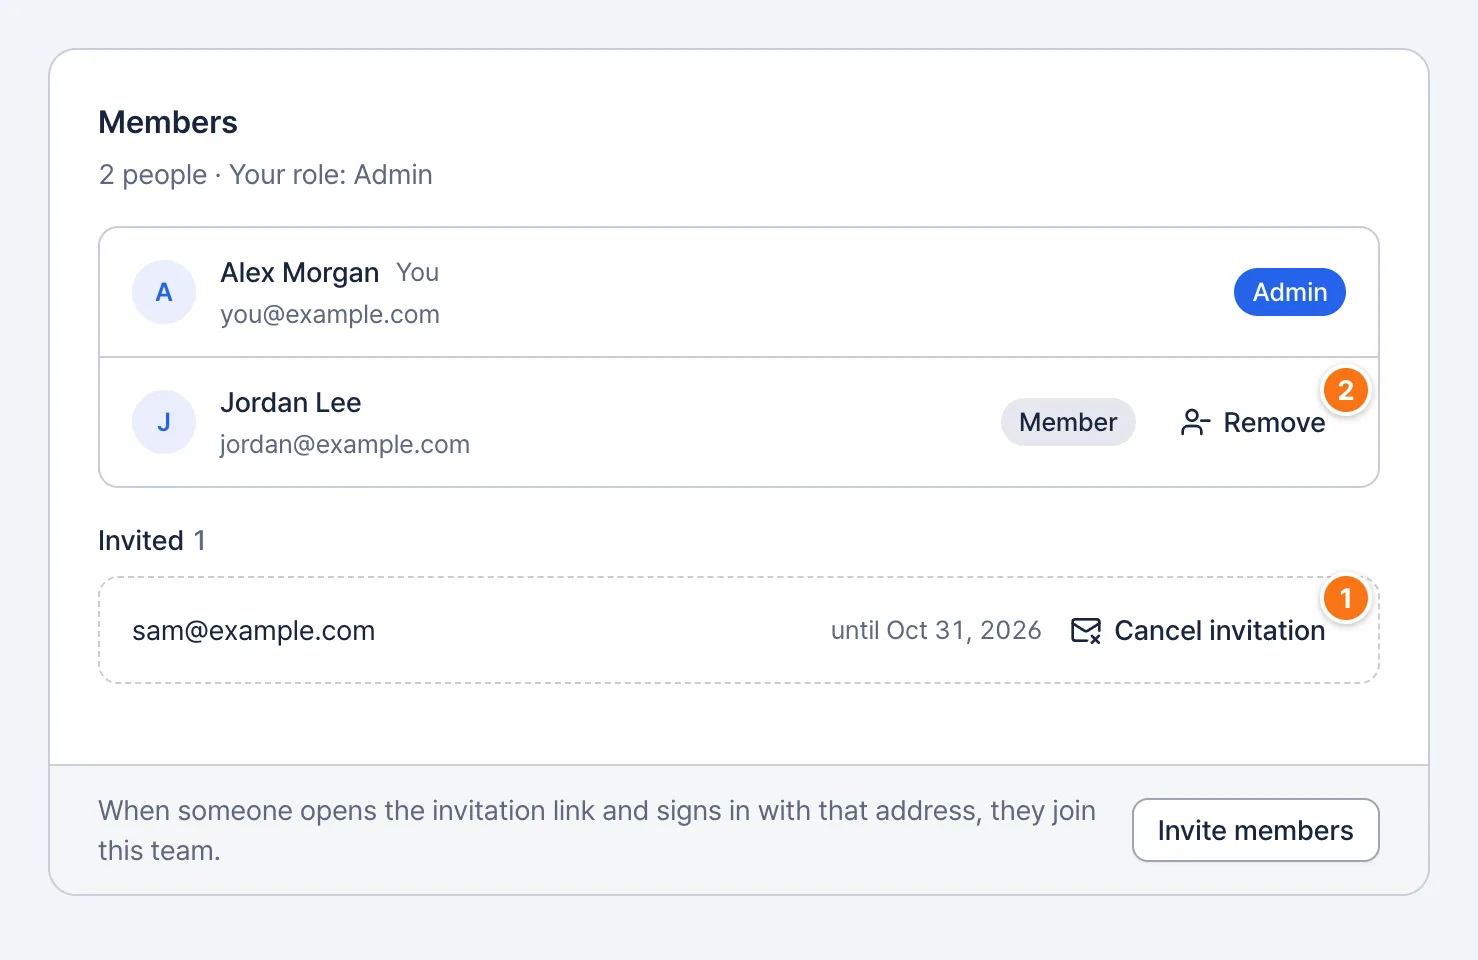
On this screen
Cancel invitation
Cancels an invitation under Invited that hasn’t been accepted yet.
Remove
Removes a member from this team. It doesn’t appear on an admin’s row.
How to use
- Select ‘Cancel invitation’ next to an invitation under Invited, or ‘Remove’ next to a member.
- Select ‘Cancel invitation’ or ‘Remove member’ in the dialog. It takes effect right away.
Checkpoints
- A cancelled invitation’s link no longer works. Inviting them again sends a new link.
- A removed member loses access to this team’s surveys and reports right away. To bring them back, invite them again.
- Only team admins can invite members, cancel invitations or remove members. Admins can’t be removed.
Switch teams
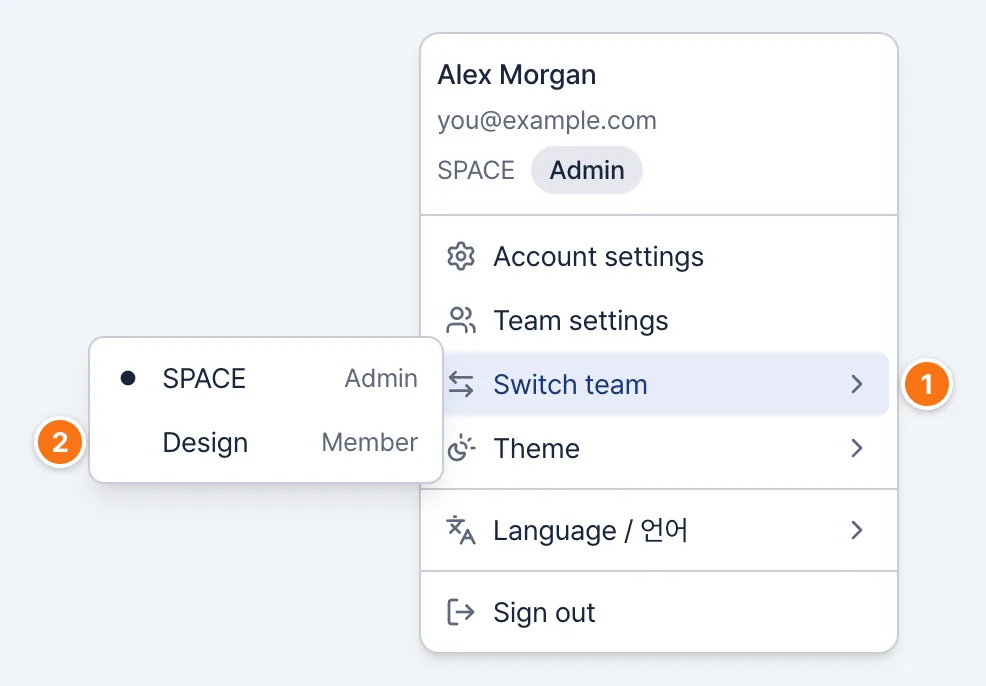
How to use
Switch team
Open the account menu in the top bar and select ‘Switch team’.
Team to switch to
Choose a team. Your role in each team shows next to its name.
Checkpoints
- ‘Switch team’ appears only when you belong to two or more teams.
- Switching takes you to My surveys and shows the surveys of the team you chose.
Account settings
Change your name, theme and password under Settings at the bottom of the left menu, or Account settings in the account menu.
Change your password
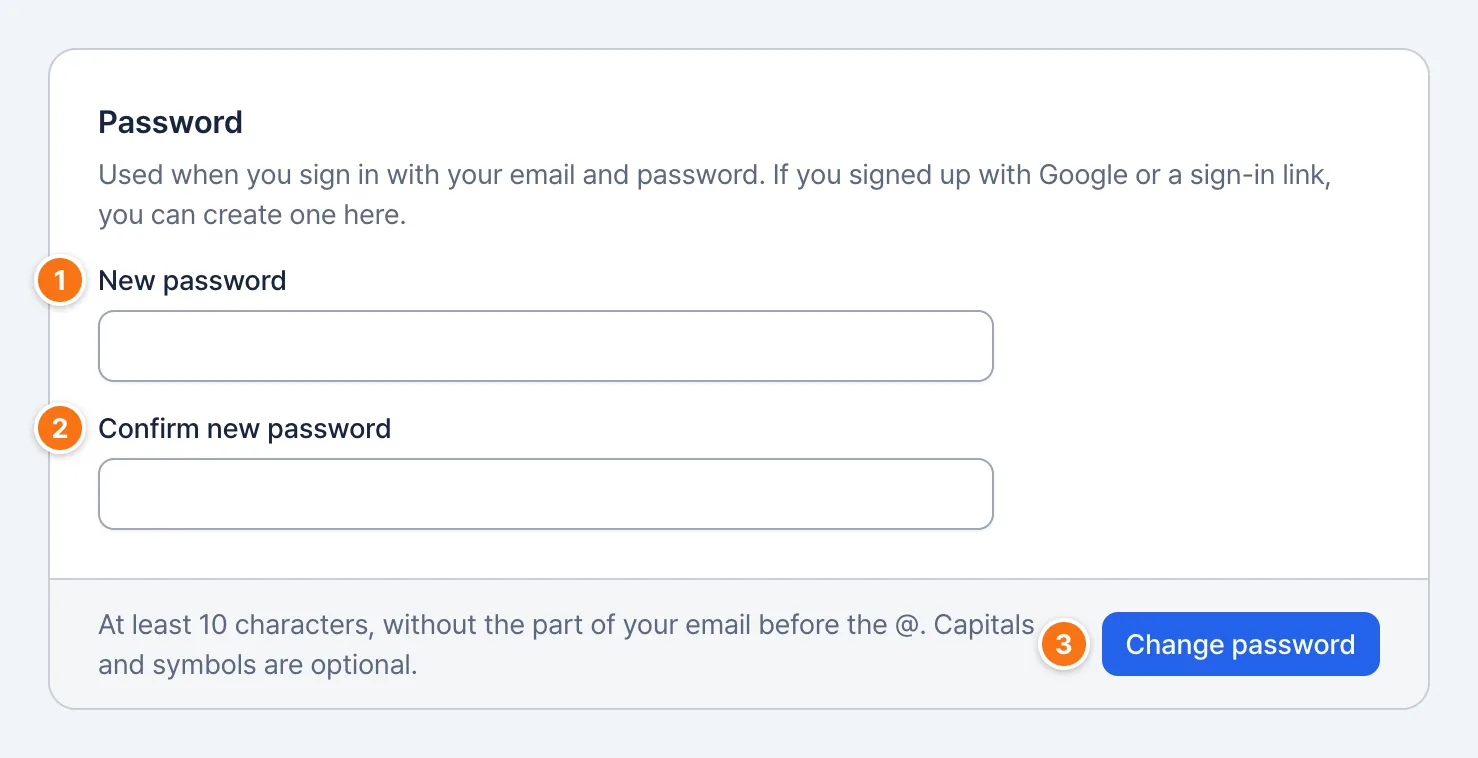
How to use
New password
Enter a new password.
Confirm new password
Enter the same password again.
Change password
Your password changes right away.
Checkpoints
- If you signed up with Google or a sign-in link, you can create a password here too.
- If you see “For security, you can change your password only after a recent sign-in.”, sign out, sign in again, then change it.
Name and theme
Checkpoints
- Your name shows in the team member list and the account menu.
- The theme is the same setting as Theme in the account menu, and it’s saved only in the browser you’re using.
Glossary
The terms you’ll see on screen, in the order you build a survey.
- Virtual customer
- An AI persona picked to match the mix you set.
- Design
- One version of the screen flow or content you show virtual customers.
- Step
- One screen a virtual customer sees.
- Action
- Something people can do on a screen, such as tapping, choosing or checking.
- Task
- What virtual customers try to do on your screens.
- Briefing
- What virtual customers read before they start.
- Interview
- One virtual customer trying one design and answering. A survey runs people × designs interviews.
- Screening criteria
- Traits of the customers you’re looking for. People who match go to the top of the list.
- Confirm
- Deciding to send the briefing to virtual customers exactly as written. Change what it’s based on, such as the screens, actions, ‘Where people see it’, task or number of designs, and you’ll need to confirm it again.
- Task completed
- When someone taps an action that leads to ‘Task completed’.
- Didn’t find it
- When someone ends without finding a way to finish the task.
- Stopped partway
- When a virtual customer stops the task on their own.
- Action limit reached
- When someone uses up the set number of actions without finishing. They count as not finishing the task.
- Reaction theme
- A reaction that came up across several virtual customers.
- 95% range
- Where the result likely falls. The fewer people, the wider it is.
- Points
- The difference between two rates. 40% and 70% are 30 points apart.
FAQ
Didn’t find your answer?
Send us a message and we’ll reply by email.